|
Download Data (XLS File) |
|
||||||||
|
||||||||
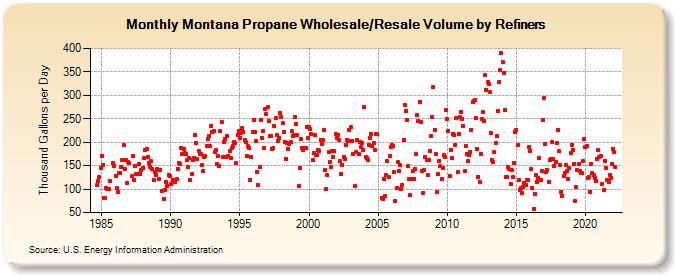
| Montana Propane Wholesale/Resale Volume by Refiners (Thousand Gallons per Day) | ||||||||
| Year | Jan | Feb | Mar | Apr | May | Jun | Jul | Aug | Sep | Oct | Nov | Dec |
|---|---|---|---|---|---|---|---|---|---|---|---|---|
| 1984 | 109.4 | 118.0 | 126.2 | 145.3 | ||||||||
| 1985 | 169.7 | 150.8 | 81.8 | 81.7 | 102.6 | 100.0 | 100.9 | 117.0 | W | W | 156.6 | 149.8 |
| 1986 | 128.7 | 102.7 | 93.9 | 134.5 | 134.3 | 147.3 | 163.1 | 194.1 | 143.0 | 162.9 | 112.8 | 157.3 |
| 1987 | 155.0 | W | 127.2 | 170.7 | 119.7 | 149.0 | 131.4 | 132.9 | 153.5 | 131.2 | 140.8 | W |
| 1988 | 146.0 | 166.3 | 183.1 | 185.0 | 168.9 | 155.1 | 146.8 | 159.7 | 143.6 | 120.0 | 136.9 | 130.8 |
| 1989 | 143.3 | 141.0 | 121.3 | 141.8 | 96.8 | W | 79.6 | 98.3 | 114.8 | 105.9 | 130.3 | 128.0 |
| 1990 | 111.7 | W | 118.7 | 114.1 | 115.3 | 120.6 | 143.9 | 154.7 | 154.0 | 188.5 | 175.9 | 184.5 |
| 1991 | 176.0 | 174.8 | 161.1 | 146.1 | 166.1 | 120.4 | 132.1 | 163.0 | 167.3 | 215.3 | 198.5 | 165.1 |
| 1992 | 180.8 | 174.5 | 173.8 | 151.2 | 138.2 | 168.1 | 169.6 | 191.1 | 206.7 | 212.8 | 191.3 | 234.2 |
| 1993 | 221.1 | 223.7 | 179.7 | 182.5 | 153.3 | 171.5 | 149.8 | 223.2 | 242.8 | 169.2 | 200.4 | 206.2 |
| 1994 | 167.8 | 213.3 | 170.1 | 181.4 | 166.9 | 186.6 | 192.0 | 199.4 | 197.8 | 155.1 | 216.4 | 224.5 |
| 1995 | 209.5 | 220.3 | 229.8 | 222.1 | 204.5 | 200.2 | 170.2 | 191.5 | 188.2 | 120.4 | 167.8 | 222.3 |
| 1996 | 247.7 | 222.6 | 203.1 | 135.9 | 109.0 | 147.8 | 247.3 | 209.8 | 224.6 | 187.8 | 269.9 | 259.6 |
| 1997 | 274.5 | 245.3 | 212.7 | 213.4 | 184.7 | 187.4 | 234.5 | 251.2 | 215.3 | 202.2 | 208.8 | 262.7 |
| 1998 | 253.3 | 240.2 | 222.3 | 200.3 | 165.2 | 197.7 | 185.0 | 196.7 | 199.6 | 223.3 | 213.9 | 216.1 |
| 1999 | 253.6 | 239.8 | 215.5 | 106.7 | 145.8 | 207.0 | 187.2 | 182.5 | 188.0 | 186.9 | 232.5 | 208.1 |
| 2000 | 232.0 | 227.3 | 217.8 | 162.0 | 177.2 | 215.0 | 172.5 | 172.4 | 182.7 | 181.3 | 204.9 | 195.4 |
| 2001 | 205.1 | 226.5 | 140.5 | 99.2 | 129.4 | 179.1 | 157.2 | 147.3 | 180.6 | 169.2 | 180.3 | 217.2 |
| 2002 | 208.2 | 215.5 | 204.5 | 159.3 | 132.3 | 152.0 | 167.6 | 165.1 | 194.8 | 204.7 | 202.5 | 226.3 |
| 2003 | 231.7 | 203.3 | 173.8 | W | 105.6 | 179.7 | 205.3 | 174.5 | 200.8 | 188.9 | 198.5 | 183.7 |
| 2004 | 274.6 | 168.1 | 166.4 | 161.0 | 193.9 | 207.9 | 217.1 | 191.4 | 197.7 | 182.8 | 218.0 | 217.2 |
| 2005 | NA | NA | NA | 81.1 | 78.6 | 122.4 | 85.8 | 129.3 | 159.1 | 125.5 | 170.3 | 189.2 |
| 2006 | 195.1 | 192.8 | 135.9 | 74.4 | 101.7 | 157.2 | 139.6 | 150.6 | 101.0 | 108.8 | 204.8 | 280.2 |
| 2007 | 267.5 | 246.4 | 148.9 | 122.4 | 86.5 | 121.9 | 138.7 | 122.2 | 141.9 | 175.8 | 258.5 | 245.1 |
| 2008 | 285.5 | 242.1 | 138.1 | 91.8 | 140.9 | 168.5 | 162.8 | 129.7 | 161.6 | 182.1 | 213.9 | 254.0 |
| 2009 | 317.5 | 226.4 | 175.5 | 92.8 | 132.7 | 160.7 | 148.2 | 121.2 | 144.5 | 172.1 | 168.2 | 269.6 |
| 2010 | 248.9 | 223.5 | 128.9 | 183.5 | 166.0 | 218.5 | 215.5 | 194.5 | 252.0 | 135.5 | 217.8 | 253.0 |
| 2011 | 265.0 | 249.6 | 235.0 | 139.5 | 192.4 | 175.8 | 159.7 | 171.8 | 179.5 | 226.9 | 286.4 | 287.6 |
| 2012 | 290.8 | 251.3 | 186.2 | 126.5 | 115.1 | 174.0 | 249.7 | 264.7 | 244.5 | 343.0 | 311.9 | 327.6 |
| 2013 | 323.6 | 306.4 | 218.8 | 161.0 | 156.8 | 178.1 | 198.6 | 212.4 | 266.7 | 327.8 | 354.9 | 389.6 |
| 2014 | 370.5 | 348.1 | 269.0 | 125.1 | 126.8 | 146.7 | 142.6 | 111.0 | 140.1 | 124.8 | 156.7 | 220.7 |
| 2015 | 226.9 | 194.3 | 119.2 | 97.7 | 101.3 | 92.7 | 105.5 | 112.5 | 108.6 | 120.0 | 119.1 | 189.6 |
| 2016 | 181.5 | 142.4 | 101.8 | 58.4 | 90.3 | 129.7 | 115.5 | 124.0 | 165.3 | 120.1 | 139.3 | 247.0 |
| 2017 | 294.6 | 196.9 | 136.6 | 140.7 | 115.5 | 161.9 | 164.3 | 200.6 | 163.4 | 150.1 | 158.4 | 197.6 |
| 2018 | 225.8 | 180.6 | 151.7 | 94.4 | 85.9 | 127.7 | 135.1 | 152.4 | 138.6 | 122.0 | 144.1 | 176.4 |
| 2019 | 194.7 | 184.4 | 154.2 | 74.7 | 104.3 | 139.9 | 153.1 | 138.9 | 134.6 | 133.7 | 160.6 | 207.4 |
| 2020 | 189.0 | 191.0 | 124.6 | 125.6 | 94.8 | 154.0 | 134.8 | 129.6 | 123.6 | 116.6 | 163.9 | 182.4 |
| 2021 | 168.7 | 169.7 | 110.8 | W | 97.5 | 160.8 | 144.0 | 120.0 | 115.9 | 130.2 | 123.4 | 153.8 |
| 2022 | 186.5 | 178.9 | 147.4 | |||||||||
| - = No Data Reported; -- = Not Applicable; NA = Not Available; W = Withheld to avoid disclosure of individual company data. |
| Release Date: 6/1/2022 |
| Next Release Date: TBD |