|
Download Data (XLS File) |
|
||||||||
|
||||||||
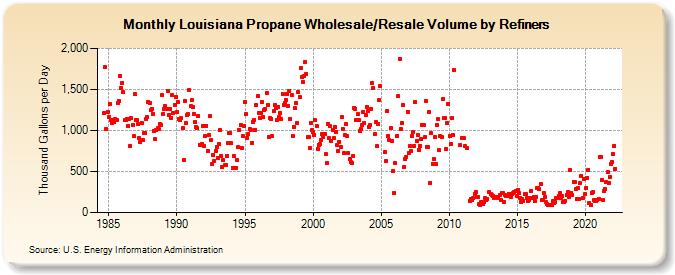
| Louisiana Propane Wholesale/Resale Volume by Refiners (Thousand Gallons per Day) | ||||||||
| Year | Jan | Feb | Mar | Apr | May | Jun | Jul | Aug | Sep | Oct | Nov | Dec |
|---|---|---|---|---|---|---|---|---|---|---|---|---|
| 1984 | 1,211.2 | 1,778.0 | 1,022.1 | 1,228.0 | ||||||||
| 1985 | 1,162.6 | 1,323.7 | 1,126.4 | 1,090.7 | 1,122.7 | 1,098.7 | 1,139.6 | 1,125.1 | 1,329.8 | 1,355.4 | 1,664.8 | 1,523.1 |
| 1986 | 1,583.8 | 1,463.7 | 1,123.1 | 1,132.8 | 1,136.7 | 1,060.3 | 1,145.4 | 814.4 | 1,146.0 | 1,069.4 | 931.0 | 1,443.5 |
| 1987 | 1,132.8 | 1,124.8 | 1,082.0 | 906.1 | 857.9 | 1,096.3 | 878.0 | 965.4 | 968.3 | 1,137.7 | 1,159.9 | 1,348.2 |
| 1988 | 1,335.0 | 1,244.1 | 1,262.7 | 1,206.2 | 999.0 | 891.8 | 1,000.8 | 1,026.0 | 1,014.5 | 1,083.8 | 1,072.0 | 1,430.3 |
| 1989 | 1,201.6 | 1,256.5 | 1,297.6 | 1,266.1 | 1,481.1 | 1,188.6 | 1,266.3 | 1,154.2 | 1,430.4 | 1,218.7 | 1,307.5 | 1,410.8 |
| 1990 | 1,227.7 | 1,343.5 | 1,144.4 | 1,124.6 | 1,149.4 | 1,028.2 | 636.4 | 1,356.4 | 1,087.8 | 1,183.7 | 1,197.6 | 1,493.1 |
| 1991 | 1,295.4 | 1,366.3 | 1,285.2 | 1,202.1 | 1,102.7 | 1,039.9 | 1,027.0 | 1,177.0 | 828.5 | 827.3 | 832.7 | 1,059.9 |
| 1992 | 811.1 | 930.8 | 1,058.0 | 753.5 | 940.0 | 1,171.6 | 881.6 | 588.1 | 707.1 | 629.5 | 751.3 | 801.5 |
| 1993 | 669.6 | 832.0 | 1,006.0 | 690.1 | 554.9 | 638.2 | 573.4 | 574.4 | 695.0 | 846.7 | 963.4 | 970.1 |
| 1994 | 841.5 | 548.7 | 686.3 | 539.3 | 545.5 | 634.3 | 794.6 | 1,005.3 | 1,067.4 | 788.5 | 931.5 | 1,057.8 |
| 1995 | 1,348.2 | 1,199.8 | 911.1 | 956.7 | 1,014.3 | 1,008.5 | 853.4 | 1,107.8 | 1,133.2 | 1,011.4 | 1,308.4 | 1,423.7 |
| 1996 | 1,215.5 | 1,157.2 | 1,209.5 | 1,351.9 | 1,158.6 | 1,249.3 | 1,263.1 | 1,461.9 | 1,313.8 | 914.6 | 1,154.0 | 1,145.1 |
| 1997 | 926.7 | 1,232.0 | 1,309.6 | 1,268.5 | 1,130.0 | 1,290.4 | 1,164.6 | 1,211.5 | 1,136.5 | 1,448.5 | 1,308.8 | 1,331.9 |
| 1998 | 1,366.8 | 1,441.2 | 1,303.4 | 1,483.1 | 1,141.5 | 1,427.0 | 933.8 | 1,045.8 | 1,271.3 | 1,329.9 | 1,092.5 | 1,465.0 |
| 1999 | 1,409.0 | 1,760.4 | 1,653.1 | 1,593.3 | 1,663.8 | 1,836.8 | 1,689.5 | 920.4 | 914.6 | 781.5 | 1,095.6 | 1,003.3 |
| 2000 | 976.9 | 942.2 | 1,124.5 | 1,056.7 | 774.7 | 820.5 | 832.3 | 882.4 | 959.2 | 916.6 | 958.6 | 709.9 |
| 2001 | 600.5 | 1,084.5 | 906.7 | 1,050.8 | 869.7 | 1,008.3 | 903.9 | 1,043.2 | 980.6 | 817.9 | 746.4 | 864.6 |
| 2002 | 804.7 | 1,158.3 | 1,020.9 | 720.1 | 943.4 | 1,073.1 | 928.9 | 722.7 | 647.6 | 616.1 | 608.8 | 685.6 |
| 2003 | 1,278.7 | 1,267.7 | 1,132.7 | 1,195.6 | 1,122.6 | 996.5 | 1,017.7 | 1,066.5 | 1,225.2 | 1,090.1 | 1,192.3 | 1,288.7 |
| 2004 | 1,236.9 | 1,041.9 | 1,065.6 | 1,264.3 | 1,573.6 | 1,518.6 | 951.6 | 1,100.7 | 805.6 | 1,083.8 | 1,373.7 | 1,536.5 |
| 2005 | NA | NA | NA | 735.9 | 627.2 | 1,231.6 | 930.2 | 887.7 | 1,030.0 | 876.5 | 501.2 | 240.6 |
| 2006 | 605.9 | W | 933.1 | 1,421.1 | 1,876.2 | 1,020.1 | 1,096.7 | 1,305.0 | 554.9 | 648.0 | 682.0 | 1,231.0 |
| 2007 | 726.6 | 810.6 | 745.3 | 936.4 | 978.7 | 814.6 | 1,348.5 | 872.4 | 946.7 | 767.1 | 816.5 | 890.6 |
| 2008 | 1,061.7 | 1,071.3 | 915.2 | 1,358.5 | 803.8 | 797.7 | 1,227.1 | 364.7 | 964.0 | 593.1 | 651.2 | 919.0 |
| 2009 | 588.3 | 1,071.8 | 1,135.5 | 758.3 | 934.0 | 917.5 | 1,389.5 | 1,156.2 | 1,153.1 | 776.2 | 1,094.6 | 1,326.2 |
| 2010 | 937.7 | 830.2 | 1,149.7 | 946.1 | 1,734.5 | W | W | W | W | 819.3 | W | 906.3 |
| 2011 | 913.9 | 902.7 | 805.7 | 783.1 | W | W | 146.3 | 165.9 | 156.5 | 172.6 | 231.7 | 247.2 |
| 2012 | 186.8 | 184.0 | 104.2 | 92.8 | 124.9 | 104.2 | 127.3 | 175.2 | 153.3 | 165.1 | W | 249.1 |
| 2013 | 231.3 | 211.1 | 205.4 | 181.8 | 187.2 | 186.9 | 192.0 | 181.0 | 210.6 | 154.6 | 237.2 | 234.3 |
| 2014 | 134.5 | 208.1 | 197.0 | 201.2 | 227.8 | 218.6 | 187.1 | 229.8 | 234.6 | 251.1 | 263.0 | 203.2 |
| 2015 | 280.7 | 238.5 | 178.4 | 129.9 | 163.8 | 144.2 | 221.4 | 223.5 | 179.5 | 138.0 | 151.2 | 181.1 |
| 2016 | 264.1 | 172.1 | 188.0 | 144.4 | 189.0 | 304.2 | 293.6 | 286.8 | 345.5 | 152.3 | 151.2 | 235.9 |
| 2017 | 190.8 | 124.3 | 102.5 | 95.1 | 88.2 | 96.9 | 89.5 | 140.1 | 118.6 | 123.3 | 176.8 | 173.5 |
| 2018 | 196.6 | 234.9 | 182.2 | 196.7 | 124.9 | 130.5 | 140.9 | 208.1 | 247.3 | 192.8 | 521.1 | 243.0 |
| 2019 | 214.6 | 373.2 | 373.9 | 284.6 | 162.2 | 293.5 | 166.9 | 361.1 | 451.4 | 176.7 | 412.2 | 222.6 |
| 2020 | 298.2 | 424.4 | 522.0 | 117.2 | 95.6 | 238.2 | 244.5 | 147.9 | 143.4 | 142.6 | 157.8 | 166.3 |
| 2021 | 679.1 | 677.4 | 399.7 | 153.4 | 266.0 | 284.9 | 374.6 | 489.3 | 359.9 | 435.8 | 594.9 | 617.8 |
| 2022 | 714.4 | 815.9 | 535.5 | |||||||||
| - = No Data Reported; -- = Not Applicable; NA = Not Available; W = Withheld to avoid disclosure of individual company data. |
| Release Date: 6/1/2022 |
| Next Release Date: TBD |