|
Download Data (XLS File) |
|
||||||||
|
||||||||
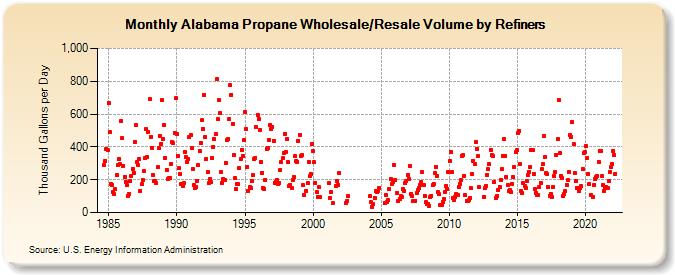
| Alabama Propane Wholesale/Resale Volume by Refiners (Thousand Gallons per Day) | ||||||||
| Year | Jan | Feb | Mar | Apr | May | Jun | Jul | Aug | Sep | Oct | Nov | Dec |
|---|---|---|---|---|---|---|---|---|---|---|---|---|
| 1984 | 290.9 | 315.7 | 385.9 | 382.2 | ||||||||
| 1985 | 668.2 | 487.7 | 173.1 | 169.3 | 127.3 | 112.5 | 141.5 | 228.4 | 288.6 | 327.8 | 295.2 | 555.6 |
| 1986 | 455.4 | 283.8 | 218.6 | 185.7 | 167.5 | 102.9 | 115.1 | 192.0 | 224.2 | 267.0 | 242.0 | 432.4 |
| 1987 | 532.6 | 307.7 | 289.4 | 323.8 | 132.0 | 172.4 | 200.4 | 250.8 | 332.4 | 508.5 | 339.3 | 491.8 |
| 1988 | 689.3 | 463.2 | 395.0 | 229.5 | 191.3 | 193.6 | 180.8 | 276.9 | 390.8 | 468.7 | 419.4 | 684.8 |
| 1989 | 448.6 | 532.5 | 332.7 | 261.2 | 205.4 | 209.1 | 210.7 | 297.7 | 427.0 | 423.4 | 486.5 | 696.6 |
| 1990 | 475.8 | 346.1 | 271.3 | 232.6 | 173.9 | 162.4 | 179.0 | 370.6 | 337.3 | 308.9 | 324.8 | 457.8 |
| 1991 | 475.3 | 393.5 | 266.0 | 169.1 | 149.3 | 157.0 | 194.3 | 288.6 | 373.7 | 425.0 | 561.1 | 512.0 |
| 1992 | 718.9 | 459.6 | 327.3 | 244.5 | 178.6 | 207.4 | 186.9 | 331.6 | 401.5 | 448.6 | 475.6 | 811.6 |
| 1993 | 568.1 | 684.3 | 604.9 | 244.1 | 178.7 | 205.1 | 199.1 | 304.1 | 439.8 | 447.6 | 568.0 | 774.8 |
| 1994 | 719.0 | 541.1 | 350.1 | 207.7 | 142.6 | 172.3 | 171.0 | 271.4 | 326.4 | 383.3 | 347.1 | 440.3 |
| 1995 | 609.5 | 510.1 | 277.5 | 133.7 | 154.6 | 152.1 | 192.5 | 228.3 | 326.3 | 334.5 | 519.7 | 596.8 |
| 1996 | 571.1 | 501.2 | 310.2 | 243.5 | 151.5 | 144.2 | 201.2 | 388.9 | 393.7 | 442.8 | 534.6 | 506.6 |
| 1997 | 523.2 | 437.6 | 183.1 | 187.9 | 201.0 | 175.9 | 182.3 | 260.5 | 305.4 | 329.5 | 364.8 | 477.9 |
| 1998 | 370.3 | 445.5 | 308.1 | 162.2 | 169.7 | 150.5 | 197.8 | 215.8 | 341.9 | 315.9 | 310.6 | 437.7 |
| 1999 | 474.1 | 346.5 | 348.2 | 166.3 | 107.3 | W | 133.1 | 177.3 | 309.4 | 222.4 | 231.9 | 418.3 |
| 2000 | 372.2 | 305.2 | 183.0 | 124.7 | 97.2 | 154.2 | 97.8 | W | W | W | W | W |
| 2001 | W | W | 179.6 | 91.1 | 126.2 | 55.8 | W | W | 163.5 | 189.6 | 170.1 | 239.5 |
| 2002 | W | W | W | W | NA | 61.2 | 72.3 | 101.3 | W | W | W | W |
| 2003 | W | W | W | W | W | W | W | W | W | W | W | W |
| 2004 | W | W | 102.0 | 61.8 | 36.9 | 49.6 | 89.8 | 129.2 | 124.3 | 130.1 | 148.8 | W |
| 2005 | NA | NA | NA | 56.7 | 106.4 | 66.9 | 74.4 | 144.0 | 201.7 | 174.9 | 183.8 | 290.1 |
| 2006 | 198.3 | W | 120.8 | 67.6 | 82.9 | 102.3 | 93.3 | 146.4 | 133.9 | 177.9 | 189.6 | 225.9 |
| 2007 | 204.6 | 285.4 | 114.5 | 99.9 | 70.0 | 70.9 | 73.3 | 121.6 | 135.4 | 148.0 | 166.8 | 185.1 |
| 2008 | 245.3 | 168.9 | 103.1 | 62.2 | 51.0 | 51.9 | 43.0 | 96.6 | 101.5 | 166.5 | 176.2 | 240.7 |
| 2009 | 280.1 | 225.5 | 123.0 | 110.5 | 49.0 | 45.2 | 67.3 | 80.3 | 124.2 | 164.8 | 143.5 | 247.3 |
| 2010 | 313.9 | 369.8 | 244.5 | 88.1 | 76.0 | 92.4 | 112.9 | 107.0 | 155.4 | 177.0 | 196.8 | 346.6 |
| 2011 | 349.0 | 224.4 | 105.4 | 73.2 | 69.0 | 74.8 | 90.1 | 148.6 | 236.4 | 316.5 | 296.8 | 426.9 |
| 2012 | 388.5 | 344.8 | 154.4 | W | W | W | 96.4 | 147.7 | 163.6 | 229.4 | 262.4 | 293.7 |
| 2013 | 380.8 | 348.7 | 345.4 | 187.7 | W | 89.8 | 99.6 | 138.8 | 158.1 | 197.6 | 263.7 | 347.5 |
| 2014 | 446.5 | 343.4 | 214.0 | 166.5 | 130.8 | 140.1 | 122.6 | 175.0 | 215.1 | 275.7 | 368.4 | 379.9 |
| 2015 | 485.3 | 497.9 | 293.6 | 131.9 | 119.2 | 178.1 | 161.7 | 148.4 | 193.6 | 229.9 | 250.0 | 278.3 |
| 2016 | 383.7 | 380.5 | 233.4 | 144.7 | 119.2 | 109.0 | 105.2 | 157.0 | 180.9 | 263.0 | 293.0 | 465.9 |
| 2017 | 336.6 | 241.7 | 234.8 | 153.9 | 103.1 | 115.8 | 96.4 | 153.6 | 222.2 | 244.5 | 352.4 | 447.2 |
| 2018 | 684.7 | 361.4 | 225.2 | 211.4 | 101.1 | 113.8 | 129.5 | 169.6 | 196.1 | 249.2 | 469.4 | 462.5 |
| 2019 | 554.0 | 415.1 | 243.6 | 191.0 | 151.2 | W | 128.8 | 152.0 | 159.8 | 266.9 | 362.3 | 368.3 |
| 2020 | 406.2 | 334.7 | 237.7 | 174.7 | 109.1 | W | 96.1 | 170.0 | 207.2 | 216.9 | 223.3 | 308.6 |
| 2021 | 375.0 | 374.2 | 220.7 | 166.0 | 130.3 | 149.0 | 154.5 | 150.2 | 189.5 | 248.3 | 278.1 | 298.8 |
| 2022 | 373.9 | 353.6 | 236.8 | |||||||||
| - = No Data Reported; -- = Not Applicable; NA = Not Available; W = Withheld to avoid disclosure of individual company data. |
| Release Date: 6/1/2022 |
| Next Release Date: TBD |