|
Download Data (XLS File) |
|
||||||||
|
||||||||
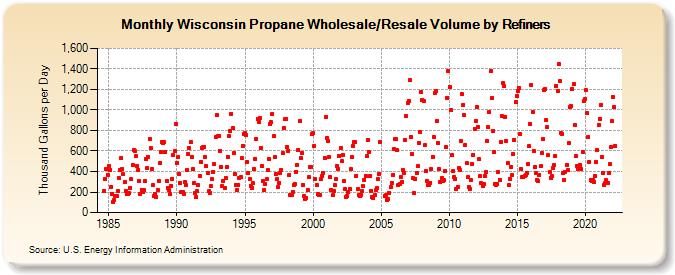
| Wisconsin Propane Wholesale/Resale Volume by Refiners (Thousand Gallons per Day) | ||||||||
| Year | Jan | Feb | Mar | Apr | May | Jun | Jul | Aug | Sep | Oct | Nov | Dec |
|---|---|---|---|---|---|---|---|---|---|---|---|---|
| 1984 | 212.2 | 329.7 | 421.8 | 369.6 | ||||||||
| 1985 | 452.6 | 415.1 | 250.3 | 183.9 | 103.2 | 122.2 | 161.4 | 162.9 | 212.5 | 335.4 | 414.1 | 533.4 |
| 1986 | 422.2 | 376.2 | 294.6 | 214.2 | 178.3 | 178.3 | 189.8 | 241.5 | 324.1 | 463.3 | 610.6 | 595.6 |
| 1987 | 550.5 | 455.8 | 418.0 | 305.8 | 185.2 | 219.7 | 197.8 | 218.4 | 304.1 | 523.3 | 434.0 | 539.2 |
| 1988 | 719.5 | 624.8 | 428.8 | 265.1 | 161.2 | 184.3 | 151.4 | 220.2 | 310.2 | 482.3 | 593.4 | 691.3 |
| 1989 | 677.3 | 686.1 | 590.7 | 307.4 | 241.6 | 216.5 | 179.9 | 262.0 | 331.3 | 558.3 | 596.3 | 861.6 |
| 1990 | 487.6 | 542.0 | 378.8 | 290.4 | 203.1 | 197.1 | 181.5 | 294.2 | 270.7 | 411.0 | 568.3 | 625.1 |
| 1991 | 684.4 | 542.1 | 422.8 | 285.6 | 195.3 | 149.9 | 205.7 | 265.4 | 357.6 | 497.1 | 629.0 | 635.8 |
| 1992 | 636.8 | 537.0 | 449.6 | 387.5 | 206.6 | 195.4 | 255.8 | 323.6 | 395.9 | 468.8 | 734.0 | 948.3 |
| 1993 | 746.3 | 742.0 | 597.5 | 444.6 | 257.6 | 303.7 | 243.8 | 339.0 | 447.3 | 544.7 | 744.4 | 792.7 |
| 1994 | 964.2 | 823.6 | 575.8 | 377.0 | 269.0 | 222.2 | 272.6 | 338.0 | 345.1 | 530.1 | 649.7 | 770.4 |
| 1995 | 771.2 | 752.8 | 493.1 | 388.2 | 324.1 | 261.8 | 240.7 | 284.7 | 426.2 | 526.2 | 716.8 | 909.5 |
| 1996 | 885.8 | 918.7 | 633.2 | 455.0 | 308.5 | 221.2 | 276.1 | 323.0 | 413.3 | 525.9 | 861.4 | 879.7 |
| 1997 | 961.6 | 746.2 | 540.3 | 373.4 | 325.8 | 251.2 | 284.6 | 382.4 | 417.1 | 576.6 | 826.3 | 909.0 |
| 1998 | 914.9 | 636.9 | 603.3 | 363.6 | 173.3 | 173.9 | 202.5 | 271.1 | 274.4 | 399.8 | 462.4 | 611.4 |
| 1999 | 890.5 | 532.2 | 582.9 | 270.0 | 163.5 | 133.9 | 143.0 | 217.1 | 342.4 | 445.1 | 446.8 | 767.2 |
| 2000 | 774.5 | 647.8 | 325.0 | 271.2 | 181.7 | 171.4 | 174.6 | 323.5 | 358.5 | 389.8 | 535.3 | 933.2 |
| 2001 | 726.5 | 699.3 | 543.7 | 345.6 | 224.1 | 173.3 | 212.5 | 265.8 | 323.8 | 452.6 | 428.3 | 554.5 |
| 2002 | 626.0 | 498.6 | 561.1 | 309.4 | 226.5 | 154.4 | 157.0 | 200.7 | 225.6 | 421.5 | 536.8 | 649.8 |
| 2003 | 688.7 | 684.5 | 360.5 | 224.8 | 171.0 | 162.3 | 174.8 | 207.7 | 255.6 | 317.6 | 358.8 | 547.7 |
| 2004 | 707.1 | 595.0 | 356.6 | 214.7 | 147.5 | 137.2 | 166.7 | 216.9 | 237.9 | 323.5 | 376.0 | 691.8 |
| 2005 | NA | NA | NA | 166.0 | 167.3 | 122.4 | 132.6 | 192.5 | 245.8 | 291.0 | 365.0 | 617.0 |
| 2006 | 714.0 | 718.0 | 605.3 | 269.6 | 281.9 | 347.8 | 297.5 | 414.7 | 389.0 | 708.6 | 937.1 | 1,063.7 |
| 2007 | 1,091.8 | 1,290.4 | 737.5 | 569.5 | 334.7 | 186.3 | 331.8 | 387.8 | 451.3 | 680.8 | 782.6 | 1,177.1 |
| 2008 | 1,098.6 | 1,086.0 | 655.8 | 404.3 | 310.7 | 270.0 | 272.9 | 291.8 | 421.8 | 545.0 | 737.2 | 1,162.0 |
| 2009 | 1,183.9 | 891.4 | 678.8 | 419.8 | 293.1 | 334.9 | 309.4 | 312.6 | 400.3 | 638.4 | 1,120.3 | 1,379.7 |
| 2010 | 1,226.2 | 1,000.1 | 557.3 | 409.9 | 349.1 | 326.0 | 226.8 | 251.8 | 430.9 | 418.5 | 697.2 | 1,156.4 |
| 2011 | 1,051.4 | 946.0 | 661.6 | 481.0 | 345.3 | 253.9 | 234.0 | 313.8 | 474.4 | 563.3 | 815.5 | 896.5 |
| 2012 | 1,033.2 | 838.2 | 517.9 | 356.1 | 285.4 | 259.2 | 273.9 | 358.7 | 395.3 | 694.1 | 830.0 | 975.3 |
| 2013 | 1,377.2 | 1,118.6 | 798.0 | 586.9 | 276.8 | 267.3 | 276.8 | 399.1 | 319.0 | 684.8 | 945.1 | 1,259.8 |
| 2014 | 1,229.0 | 935.6 | 698.5 | 483.6 | 266.2 | 330.9 | 447.7 | 365.7 | 568.3 | 709.8 | 1,073.9 | 1,134.8 |
| 2015 | 1,189.5 | 1,214.8 | 763.9 | 420.6 | 346.3 | 344.1 | 358.7 | 362.0 | 388.8 | 471.8 | 645.4 | 867.5 |
| 2016 | 1,242.9 | 983.9 | 600.7 | 443.6 | 386.8 | 318.6 | 306.0 | 368.5 | 450.4 | 581.0 | 720.6 | 1,192.4 |
| 2017 | 1,204.4 | 903.4 | 829.2 | 556.3 | 395.6 | 341.0 | 359.0 | 435.5 | 464.7 | 554.9 | 1,237.5 | 1,181.8 |
| 2018 | 1,444.2 | 1,278.6 | 775.0 | 769.9 | 382.7 | 319.3 | 399.2 | 465.3 | 411.6 | 678.3 | 1,029.0 | 1,038.1 |
| 2019 | 1,207.6 | 1,253.8 | 850.4 | 549.3 | 456.1 | 429.1 | 433.1 | 463.3 | 421.2 | 589.8 | 1,083.2 | 1,102.7 |
| 2020 | 1,193.8 | 971.7 | 738.2 | 497.0 | 316.7 | 303.6 | 321.1 | 301.5 | 360.1 | 492.5 | 609.3 | 856.8 |
| 2021 | 916.6 | 1,052.2 | 542.7 | 390.3 | 271.5 | 283.4 | 312.8 | 289.7 | 386.7 | 470.4 | 634.9 | 888.4 |
| 2022 | 1,128.4 | 1,025.1 | 650.7 | |||||||||
| - = No Data Reported; -- = Not Applicable; NA = Not Available; W = Withheld to avoid disclosure of individual company data. |
| Release Date: 6/1/2022 |
| Next Release Date: TBD |