|
Download Data (XLS File) |
|
||||||||
|
||||||||
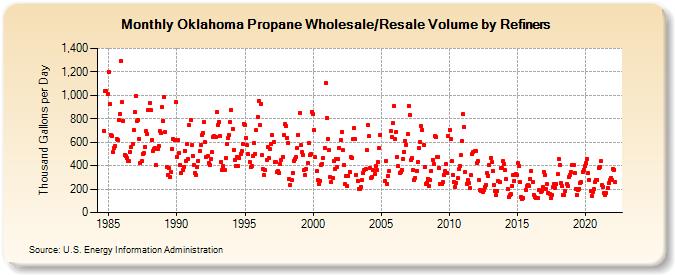
| Oklahoma Propane Wholesale/Resale Volume by Refiners (Thousand Gallons per Day) | ||||||||
| Year | Jan | Feb | Mar | Apr | May | Jun | Jul | Aug | Sep | Oct | Nov | Dec |
|---|---|---|---|---|---|---|---|---|---|---|---|---|
| 1984 | 698.9 | 1,040.6 | 1,036.4 | 1,012.0 | ||||||||
| 1985 | 1,200.9 | 922.6 | 664.5 | 654.8 | 513.2 | 548.7 | 567.5 | 623.5 | 616.1 | 792.0 | 841.2 | 1,289.1 |
| 1986 | 938.6 | 784.5 | 495.1 | 479.4 | 461.6 | 440.5 | 436.0 | 519.1 | 559.9 | 584.1 | 705.8 | 859.5 |
| 1987 | 990.0 | 778.0 | 785.9 | 627.7 | 421.1 | 435.7 | 502.3 | 505.7 | 561.2 | 691.5 | 673.7 | 872.6 |
| 1988 | 937.2 | 872.9 | 619.7 | 524.3 | 543.6 | 548.2 | 402.0 | 540.4 | 567.8 | 696.5 | 679.3 | 899.5 |
| 1989 | 780.9 | 989.7 | 684.9 | 392.1 | 317.6 | 377.2 | 299.2 | 344.6 | 537.9 | 628.6 | 622.3 | 939.6 |
| 1990 | 476.2 | 616.1 | 509.9 | 407.2 | 335.2 | 362.5 | 391.9 | 527.9 | 440.5 | 580.8 | 460.4 | 744.3 |
| 1991 | 785.4 | 574.0 | 486.3 | 406.6 | 338.6 | 317.4 | 385.2 | 443.9 | 526.1 | 578.6 | 658.7 | 682.6 |
| 1992 | 770.0 | 599.9 | 474.9 | 481.3 | 423.1 | 404.6 | 458.1 | 512.5 | 641.7 | 651.4 | 645.1 | 855.6 |
| 1993 | 746.4 | 775.3 | 649.7 | 432.4 | 361.0 | 396.8 | 363.2 | 465.5 | 588.8 | 635.5 | 661.0 | 774.1 |
| 1994 | 874.6 | 714.5 | 534.9 | 450.6 | 399.5 | 476.9 | 395.0 | 466.5 | 501.3 | 521.0 | 584.1 | 755.5 |
| 1995 | 745.9 | 639.4 | 574.6 | 496.7 | 433.6 | 389.2 | 395.9 | 478.6 | 593.0 | 502.5 | 703.9 | 815.7 |
| 1996 | 954.9 | 746.6 | 927.2 | 487.0 | 369.1 | 319.6 | 358.7 | 450.5 | 555.9 | 464.1 | 544.7 | 586.9 |
| 1997 | 657.5 | 598.9 | 429.3 | 433.5 | 344.4 | 356.4 | 339.9 | 411.9 | 449.8 | 477.2 | 657.4 | 752.9 |
| 1998 | 738.5 | 636.6 | 595.0 | 284.7 | 236.3 | 276.2 | 341.1 | 440.1 | 455.5 | 469.7 | 546.8 | 664.4 |
| 1999 | 851.9 | 572.5 | 514.8 | 495.1 | 365.3 | 317.1 | 371.1 | 426.1 | 593.3 | 488.7 | 501.2 | 860.7 |
| 2000 | 837.2 | 703.9 | 471.4 | 353.4 | 275.5 | 243.1 | 272.6 | 409.7 | 415.8 | 463.6 | 550.9 | 1,105.8 |
| 2001 | 807.6 | 626.6 | 532.7 | 299.9 | 259.4 | 292.6 | 435.8 | 375.7 | 455.8 | 385.3 | 454.5 | 553.7 |
| 2002 | 617.0 | 689.8 | 532.8 | 406.8 | 242.8 | 315.2 | 225.1 | 313.2 | 348.4 | 473.3 | 468.0 | 628.4 |
| 2003 | 719.2 | 625.1 | 324.4 | 272.8 | 201.7 | 204.5 | 221.6 | 274.7 | 334.4 | 358.7 | 370.8 | 532.5 |
| 2004 | 750.3 | 650.4 | 380.9 | 292.6 | 302.2 | 362.2 | 326.8 | 397.4 | 359.5 | 429.5 | 548.2 | 663.0 |
| 2005 | NA | NA | NA | 266.0 | 441.0 | 247.6 | 313.0 | 357.3 | 695.6 | 646.4 | 760.0 | 907.7 |
| 2006 | 627.4 | 689.4 | 473.9 | 395.5 | 337.8 | 341.9 | 365.4 | 458.5 | 518.9 | 612.2 | 578.9 | 667.2 |
| 2007 | 912.6 | 835.8 | 451.6 | 463.1 | 358.9 | 276.2 | 297.7 | 355.4 | 432.0 | 550.4 | 601.6 | 736.0 |
| 2008 | 707.9 | 577.8 | 388.5 | 247.8 | 256.0 | 289.9 | 226.2 | 276.1 | 357.4 | 451.2 | 415.9 | 651.3 |
| 2009 | 646.3 | 470.4 | 476.0 | 379.2 | 245.6 | 247.3 | 259.0 | 321.1 | 358.5 | 412.6 | 340.1 | 652.7 |
| 2010 | 707.7 | 627.3 | 437.2 | 323.7 | 258.8 | 220.6 | 254.1 | 292.3 | 369.2 | 394.1 | 486.9 | 611.1 |
| 2011 | 836.5 | 725.5 | 344.7 | 245.6 | 275.3 | 249.4 | 210.1 | 319.6 | 499.0 | 517.2 | 523.2 | 522.7 |
| 2012 | 422.5 | 436.4 | 276.5 | 192.4 | 182.9 | 175.2 | 194.3 | 220.1 | 238.7 | 334.3 | 312.4 | 405.6 |
| 2013 | 469.3 | 427.2 | 358.3 | 238.1 | 182.9 | 145.9 | 185.5 | 266.6 | 260.9 | 376.7 | 376.9 | 436.7 |
| 2014 | 412.2 | 360.5 | 284.2 | 201.9 | 132.5 | 148.1 | 156.1 | 228.2 | 317.0 | 271.9 | 328.9 | 324.3 |
| 2015 | 418.4 | 395.0 | 258.1 | 136.0 | 116.4 | 124.0 | W | 195.0 | 222.7 | 234.6 | 227.8 | 289.1 |
| 2016 | 355.3 | 263.7 | 152.8 | 129.5 | 125.3 | 125.3 | 123.7 | 191.4 | 178.5 | 186.7 | 219.4 | 348.4 |
| 2017 | 316.4 | 199.9 | 241.1 | 169.6 | 162.4 | 121.9 | 148.6 | 215.8 | 240.3 | 211.3 | 245.8 | 324.6 |
| 2018 | 460.5 | 407.8 | 253.8 | 225.4 | 150.2 | 152.3 | 180.2 | 244.3 | 226.1 | 304.7 | 322.9 | 345.0 |
| 2019 | 406.0 | 404.3 | 336.6 | 202.7 | 153.7 | 195.5 | 203.8 | 256.1 | 259.9 | 348.4 | 364.0 | 394.0 |
| 2020 | 422.4 | 458.8 | 338.4 | 280.1 | 181.9 | 143.9 | 176.2 | 200.7 | 262.7 | 279.8 | 279.1 | 381.7 |
| 2021 | 392.6 | 438.5 | 231.8 | 219.5 | 169.4 | 150.7 | 165.1 | 211.5 | 248.5 | 276.4 | 298.8 | 281.2 |
| 2022 | 372.1 | 366.3 | 258.5 | |||||||||
| - = No Data Reported; -- = Not Applicable; NA = Not Available; W = Withheld to avoid disclosure of individual company data. |
| Release Date: 6/1/2022 |
| Next Release Date: TBD |