|
Download Data (XLS File) |
|
||||||||
|
||||||||
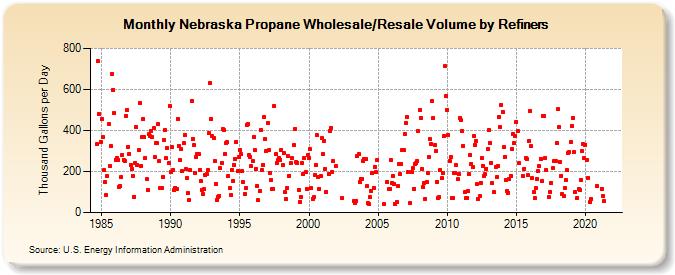
| Nebraska Propane Wholesale/Resale Volume by Refiners (Thousand Gallons per Day) | ||||||||
| Year | Jan | Feb | Mar | Apr | May | Jun | Jul | Aug | Sep | Oct | Nov | Dec |
|---|---|---|---|---|---|---|---|---|---|---|---|---|
| 1984 | 331.7 | 736.4 | 478.6 | 346.2 | ||||||||
| 1985 | 457.8 | 366.4 | 205.6 | 148.0 | 86.4 | 176.0 | 429.6 | 229.1 | 324.0 | 677.6 | 597.3 | 485.1 |
| 1986 | 258.5 | 266.7 | 258.3 | 126.7 | 131.3 | 172.5 | 282.5 | 256.1 | 249.2 | 472.9 | 500.1 | 320.1 |
| 1987 | 287.0 | 232.1 | 214.2 | 179.9 | 77.1 | 240.8 | 415.9 | 231.3 | 303.2 | 533.5 | 226.9 | 366.1 |
| 1988 | 456.5 | 365.9 | 264.8 | 161.3 | 111.9 | 382.4 | 372.8 | 398.2 | 368.1 | 411.5 | 269.4 | 338.8 |
| 1989 | 339.4 | 429.8 | 251.0 | 121.4 | 118.0 | 172.2 | 351.8 | 401.2 | 264.7 | 314.4 | 239.3 | 519.6 |
| 1990 | 197.9 | 320.4 | 206.5 | 108.2 | 122.1 | 113.0 | 456.5 | 326.5 | 255.2 | 311.7 | 202.2 | 336.8 |
| 1991 | 378.9 | 210.5 | 167.3 | 94.3 | 59.0 | 206.7 | 545.9 | 360.5 | 327.5 | 194.6 | 271.8 | 286.9 |
| 1992 | 287.5 | 208.6 | 152.2 | 112.3 | 89.5 | 113.0 | 182.2 | 189.1 | 205.7 | 385.8 | 631.7 | 455.3 |
| 1993 | 370.7 | 365.4 | 251.1 | 139.1 | 63.1 | 76.6 | 81.7 | 215.2 | 242.5 | 406.7 | 402.5 | 286.3 |
| 1994 | 337.3 | 341.5 | 178.6 | 117.9 | 86.2 | 209.1 | 153.8 | 233.5 | 262.9 | 345.5 | 202.0 | 269.4 |
| 1995 | 306.3 | 283.9 | 203.1 | 147.3 | 91.4 | 121.3 | 427.8 | 430.8 | 280.2 | 272.3 | 225.4 | 249.2 |
| 1996 | 369.9 | 303.9 | 212.8 | 129.5 | 59.2 | 103.9 | 402.5 | 206.6 | 234.0 | 464.0 | 356.8 | 301.8 |
| 1997 | 437.9 | 303.0 | 194.6 | 158.0 | 114.1 | 115.4 | 519.2 | 283.2 | 241.0 | 257.5 | 264.3 | 258.1 |
| 1998 | 305.4 | 230.7 | 288.0 | 98.8 | 66.7 | 120.5 | 273.3 | 180.3 | 240.0 | 265.5 | W | 327.7 |
| 1999 | 408.6 | 248.1 | 243.7 | 109.1 | 53.8 | 76.7 | 243.6 | 186.6 | 265.2 | 196.9 | 117.1 | 278.3 |
| 2000 | 268.3 | 308.1 | 120.7 | 67.9 | 73.7 | 185.2 | 230.9 | 375.8 | 175.1 | 116.1 | 177.5 | 361.1 |
| 2001 | 283.4 | 350.5 | 213.4 | 101.4 | W | 188.2 | 397.5 | 413.6 | 198.2 | 249.3 | W | 226.2 |
| 2002 | W | W | W | W | W | 71.0 | W | W | W | W | W | W |
| 2003 | W | W | W | 58.6 | 45.2 | 56.8 | 274.0 | 284.6 | 150.3 | 165.0 | 163.5 | 250.4 |
| 2004 | 262.7 | 260.3 | 127.5 | 46.0 | 39.8 | 73.6 | 106.9 | 193.5 | 122.0 | 223.3 | 195.3 | 253.7 |
| 2005 | NA | NA | NA | W | W | 39.3 | W | W | 148.4 | 112.8 | 117.1 | 256.4 |
| 2006 | 145.1 | 178.7 | 138.8 | 40.7 | 51.1 | 129.4 | 235.1 | 187.3 | 236.0 | 303.1 | 303.7 | 380.6 |
| 2007 | 437.6 | 464.5 | 198.5 | NA | 47.3 | 195.3 | 216.6 | 116.4 | 236.0 | 240.7 | 250.2 | 395.6 |
| 2008 | 498.8 | 461.1 | 213.9 | 123.9 | 141.7 | 67.4 | 151.2 | 194.0 | 270.9 | 356.7 | 335.3 | 541.2 |
| 2009 | 460.6 | 330.4 | 300.5 | 149.3 | 69.8 | 76.4 | 206.3 | 167.1 | 193.2 | 375.4 | 712.4 | 568.1 |
| 2010 | 501.4 | 376.3 | 252.1 | 269.4 | 71.0 | 70.5 | 193.5 | 194.3 | 229.4 | 161.4 | 189.9 | 459.6 |
| 2011 | 448.9 | 397.9 | 325.3 | 98.5 | 69.1 | 72.4 | 106.2 | 188.3 | 280.5 | 237.6 | 219.7 | 375.0 |
| 2012 | 330.5 | 346.6 | 137.9 | 66.7 | 78.5 | 145.7 | 264.8 | 229.3 | 176.7 | 186.0 | 214.6 | 311.6 |
| 2013 | 402.0 | 340.6 | 242.6 | 142.3 | W | 99.6 | 223.9 | 171.9 | 227.8 | 466.1 | 415.1 | 524.5 |
| 2014 | 491.7 | 317.4 | 271.8 | 159.8 | 105.9 | 97.4 | 161.7 | 180.3 | 310.5 | 384.7 | 336.9 | 374.7 |
| 2015 | 443.2 | 398.5 | 241.8 | W | W | W | 178.5 | 214.2 | 265.0 | 261.1 | 181.8 | 349.8 |
| 2016 | 495.3 | 322.5 | 167.1 | 99.8 | 69.3 | 117.9 | 164.3 | 202.4 | 224.5 | 262.7 | 152.0 | 468.6 |
| 2017 | 470.2 | 266.6 | 209.1 | W | 76.7 | 102.0 | 143.2 | W | 217.1 | 253.4 | 249.3 | 338.8 |
| 2018 | 503.4 | 417.6 | 246.7 | 179.1 | 88.5 | 79.0 | 118.9 | 158.5 | 206.7 | 289.2 | 295.1 | 341.8 |
| 2019 | 421.0 | 461.8 | 293.7 | 98.7 | W | 72.2 | 115.5 | 110.3 | 159.5 | 298.9 | 331.9 | 267.9 |
| 2020 | 330.8 | 258.4 | 168.0 | W | 50.1 | 66.9 | W | W | W | W | 127.9 | W |
| 2021 | W | W | 116.9 | 82.0 | 55.6 | W | W | W | W | W | W | W |
| 2022 | W | W | W | |||||||||
| - = No Data Reported; -- = Not Applicable; NA = Not Available; W = Withheld to avoid disclosure of individual company data. |
| Release Date: 6/1/2022 |
| Next Release Date: TBD |