|
Download Data (XLS File) |
|
||||||||
|
||||||||
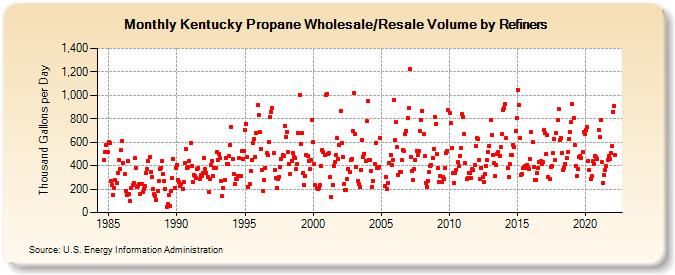
| Kentucky Propane Wholesale/Resale Volume by Refiners (Thousand Gallons per Day) | ||||||||
| Year | Jan | Feb | Mar | Apr | May | Jun | Jul | Aug | Sep | Oct | Nov | Dec |
|---|---|---|---|---|---|---|---|---|---|---|---|---|
| 1984 | 448.7 | 515.8 | 579.5 | 517.6 | ||||||||
| 1985 | 598.2 | 592.0 | 270.7 | 235.3 | 150.7 | 209.7 | 276.9 | 252.3 | 339.7 | 446.2 | 370.7 | 531.4 |
| 1986 | 611.2 | 422.2 | 327.3 | 186.5 | 148.6 | 436.9 | 157.1 | 95.6 | 209.2 | 233.5 | 249.0 | 463.7 |
| 1987 | 382.5 | 219.6 | 229.1 | 239.7 | 160.7 | 239.8 | 174.0 | 204.3 | 227.5 | 338.8 | 371.0 | 440.4 |
| 1988 | 470.5 | 342.2 | 302.3 | 201.4 | 157.2 | 141.4 | 109.5 | 187.5 | 270.8 | 371.7 | 383.1 | 442.1 |
| 1989 | 324.6 | 265.4 | 201.4 | 45.5 | 73.6 | 151.4 | 57.5 | 185.5 | 298.4 | 456.2 | 213.4 | 376.7 |
| 1990 | 407.1 | 277.4 | 263.7 | 225.6 | 243.0 | 198.1 | 264.3 | 422.4 | 540.0 | 379.8 | 387.2 | 441.7 |
| 1991 | 591.7 | 393.4 | 262.7 | 318.9 | 310.4 | 298.6 | 371.4 | 378.1 | 283.4 | 317.1 | 315.3 | 338.6 |
| 1992 | 464.5 | 373.4 | 340.5 | 304.5 | 178.5 | 288.7 | 407.5 | 439.3 | 310.5 | 376.5 | 376.2 | 517.9 |
| 1993 | 447.9 | 498.6 | 466.3 | 266.2 | 138.3 | 208.8 | 274.1 | 468.0 | 416.8 | 411.1 | 479.7 | 577.5 |
| 1994 | 730.5 | 452.6 | 330.5 | 242.5 | 289.6 | 286.2 | 315.7 | 466.7 | 313.7 | 523.3 | 458.3 | 524.5 |
| 1995 | 705.2 | 757.7 | 472.3 | 215.9 | 244.5 | 357.5 | 448.2 | 589.7 | 623.1 | 474.6 | 680.2 | 916.1 |
| 1996 | 835.9 | 688.4 | 543.8 | 362.9 | 183.4 | 277.1 | 383.2 | 505.7 | 491.8 | 604.5 | 815.1 | 855.8 |
| 1997 | 891.5 | 507.5 | 364.8 | 298.4 | 212.1 | 286.2 | 307.2 | 384.6 | 460.8 | 487.1 | 483.1 | 739.0 |
| 1998 | 646.5 | 690.9 | 518.5 | 414.2 | 332.8 | 440.0 | 506.2 | 474.4 | 461.2 | 369.1 | 412.5 | 677.2 |
| 1999 | 1,002.4 | 586.6 | 681.8 | 336.8 | 233.2 | 312.6 | 492.2 | 482.5 | 439.3 | 370.0 | 449.1 | 786.3 |
| 2000 | 600.9 | 413.0 | 232.0 | 207.7 | 200.9 | 210.1 | 232.9 | 394.4 | 537.0 | 512.2 | 492.5 | 1,005.1 |
| 2001 | 1,011.7 | 497.4 | 506.7 | 299.7 | 130.3 | 233.3 | 394.7 | 429.2 | 492.8 | 635.7 | 458.2 | 572.8 |
| 2002 | 863.8 | 592.0 | 472.4 | 243.7 | 195.3 | 193.6 | 282.6 | 372.5 | 349.9 | 446.6 | 459.8 | 694.5 |
| 2003 | 1,020.4 | 671.2 | 387.6 | 269.3 | 242.5 | 216.3 | 363.0 | 616.5 | 474.5 | 502.1 | 440.0 | 776.7 |
| 2004 | 952.6 | 450.2 | 451.8 | 358.2 | 221.5 | 270.6 | 411.4 | 589.4 | 382.8 | 381.9 | 392.4 | 638.2 |
| 2005 | NA | NA | NA | 228.5 | 300.5 | 204.0 | 253.3 | 426.2 | 493.3 | 402.9 | 449.0 | 959.8 |
| 2006 | 621.0 | 770.1 | 558.6 | 321.2 | 349.3 | 348.7 | 445.7 | 535.6 | 522.1 | 673.5 | 699.1 | 806.1 |
| 2007 | 888.9 | 1,221.6 | 470.7 | 356.8 | 277.3 | 373.2 | 446.9 | 529.2 | 493.5 | 525.6 | 694.7 | 788.7 |
| 2008 | 864.0 | 665.8 | 479.3 | 253.9 | 219.3 | 272.8 | 343.6 | 393.2 | 403.7 | 467.4 | 541.2 | 811.5 |
| 2009 | 757.6 | 498.1 | 376.5 | 257.9 | 313.4 | 259.4 | 306.9 | 289.2 | 376.2 | 510.0 | 522.0 | 872.1 |
| 2010 | 851.9 | 765.4 | 549.9 | 335.8 | 254.8 | 340.3 | 367.2 | 428.0 | 396.3 | 484.8 | 546.9 | 837.2 |
| 2011 | 817.7 | 667.1 | 419.8 | 282.9 | 291.1 | 334.3 | 335.6 | 296.7 | 371.4 | 362.6 | 405.8 | 568.9 |
| 2012 | 635.3 | 628.3 | 450.5 | 286.8 | 382.4 | 300.3 | 259.5 | 327.6 | 400.4 | 449.6 | 517.2 | 571.7 |
| 2013 | 788.3 | 663.9 | 492.3 | 418.4 | 312.4 | 406.2 | 498.9 | 520.6 | 481.0 | 560.8 | 669.1 | 876.9 |
| 2014 | 888.4 | 922.4 | 632.5 | 382.5 | 300.1 | 413.2 | 493.4 | 489.5 | 577.9 | 561.9 | 693.9 | 808.8 |
| 2015 | 1,048.1 | 921.2 | 633.8 | 318.2 | 330.4 | 378.8 | 398.7 | 382.1 | 407.3 | 387.7 | 372.8 | 456.8 |
| 2016 | 686.0 | 601.5 | 392.1 | 280.3 | 275.6 | 333.9 | 378.9 | 432.9 | 437.7 | 417.3 | 427.4 | 703.7 |
| 2017 | 681.9 | 500.6 | 658.2 | 301.3 | 288.1 | 387.3 | 396.7 | 503.7 | 623.1 | 444.9 | 675.2 | 785.8 |
| 2018 | 884.1 | 617.5 | 639.4 | 509.5 | 366.1 | 379.9 | 416.8 | 467.9 | 516.4 | 631.2 | 689.1 | 768.8 |
| 2019 | 929.1 | 807.3 | 580.3 | 397.7 | 315.6 | 371.2 | 474.2 | 482.5 | 464.6 | 515.6 | 687.9 | 670.8 |
| 2020 | 700.3 | 730.1 | 441.5 | 360.4 | 289.4 | 308.1 | 438.1 | 410.1 | 479.9 | 470.8 | 457.5 | 705.3 |
| 2021 | 640.4 | 787.5 | 429.9 | 252.4 | 321.7 | 363.3 | 396.7 | 445.5 | 479.5 | 454.2 | 505.4 | 567.3 |
| 2022 | 860.5 | 911.5 | 488.5 | |||||||||
| - = No Data Reported; -- = Not Applicable; NA = Not Available; W = Withheld to avoid disclosure of individual company data. |
| Release Date: 6/1/2022 |
| Next Release Date: TBD |