|
Download Data (XLS File) |
|
||||||||
|
||||||||
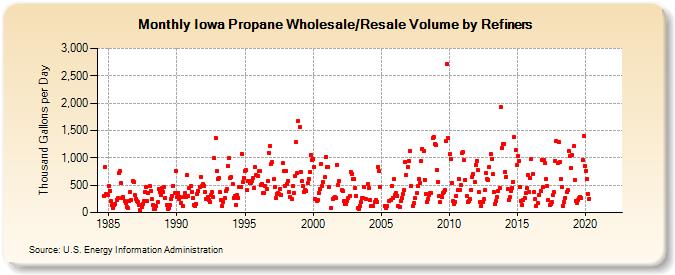
| Iowa Propane Wholesale/Resale Volume by Refiners (Thousand Gallons per Day) | ||||||||
| Year | Jan | Feb | Mar | Apr | May | Jun | Jul | Aug | Sep | Oct | Nov | Dec |
|---|---|---|---|---|---|---|---|---|---|---|---|---|
| 1984 | 308.2 | 831.8 | 341.2 | 316.8 | ||||||||
| 1985 | 488.2 | 401.9 | 205.5 | 129.7 | 77.8 | 129.9 | 162.6 | 238.4 | 265.6 | 722.8 | 756.5 | 537.4 |
| 1986 | 263.7 | 290.0 | 206.5 | 169.7 | 98.0 | 81.5 | 211.3 | 379.4 | 231.4 | 573.0 | 557.3 | 312.0 |
| 1987 | 247.0 | 207.6 | 198.3 | 131.7 | 49.6 | 97.1 | 163.0 | 203.1 | 380.6 | 470.6 | 209.5 | 364.3 |
| 1988 | 477.6 | 401.8 | 241.2 | 140.2 | 64.4 | 69.2 | 114.0 | 188.3 | 422.3 | 371.8 | 323.9 | 444.7 |
| 1989 | 379.3 | 464.5 | 273.7 | 130.3 | 69.4 | 80.7 | 139.8 | 249.6 | 311.2 | 492.7 | 354.6 | 758.7 |
| 1990 | 280.3 | 365.1 | 252.8 | 282.4 | 182.3 | 120.0 | 280.7 | 357.4 | 286.7 | 677.9 | 300.8 | 442.3 |
| 1991 | 484.3 | 384.1 | 271.8 | 142.5 | 123.4 | 165.4 | 331.3 | 389.2 | 468.0 | 655.7 | 483.9 | 519.7 |
| 1992 | 488.8 | 377.4 | 256.9 | 276.9 | 237.0 | 193.3 | 313.0 | 371.1 | 282.2 | 993.1 | 1,368.3 | 751.4 |
| 1993 | 616.5 | 631.9 | 368.7 | 231.9 | 111.1 | 199.5 | 264.3 | 388.8 | 438.7 | 857.9 | 989.2 | 623.6 |
| 1994 | 642.9 | 517.6 | 273.7 | 299.0 | 139.3 | 320.0 | 271.7 | 472.4 | 467.3 | 1,078.9 | 549.9 | 632.1 |
| 1995 | 760.6 | 777.5 | 408.3 | 585.7 | 541.5 | 547.7 | 581.7 | 634.2 | 448.5 | 829.8 | 677.8 | 672.3 |
| 1996 | 758.2 | 753.6 | 504.9 | 522.7 | 350.6 | 350.1 | 480.6 | 430.2 | 577.1 | 1,094.5 | 1,218.0 | 881.0 |
| 1997 | 919.6 | 607.9 | 471.3 | 262.5 | 342.3 | 354.5 | 341.8 | 437.2 | 315.3 | 901.6 | 754.2 | 486.3 |
| 1998 | 752.4 | 527.1 | 584.6 | 378.5 | 283.4 | 240.5 | 488.9 | 359.7 | 670.1 | 1,281.7 | 722.1 | 1,674.8 |
| 1999 | 1,565.9 | 743.1 | 568.7 | 476.7 | 379.5 | 403.4 | 385.5 | 537.0 | 609.7 | 738.0 | 1,047.9 | 968.7 |
| 2000 | 979.3 | 836.4 | 247.0 | 213.8 | 237.8 | 357.4 | 426.9 | 893.9 | 477.3 | 549.5 | 643.7 | 1,016.7 |
| 2001 | 836.0 | 836.9 | 469.6 | W | 90.5 | 254.9 | 266.9 | 276.2 | 271.7 | 877.3 | 507.1 | 567.9 |
| 2002 | W | 409.2 | 387.3 | 215.1 | 151.5 | 156.2 | 206.5 | 268.1 | 311.7 | 737.9 | 696.7 | 610.5 |
| 2003 | 608.3 | 443.5 | 310.2 | 76.4 | 56.9 | 120.5 | 191.7 | 259.1 | 265.6 | 460.1 | 252.5 | W |
| 2004 | 521.5 | 442.6 | 226.1 | 116.9 | NA | 118.6 | 191.0 | 227.4 | 191.1 | 832.6 | 758.2 | 466.2 |
| 2005 | NA | NA | NA | 119.3 | 87.3 | 115.0 | W | 208.2 | 221.6 | 484.8 | 262.7 | 607.4 |
| 2006 | 318.5 | 359.5 | 307.6 | 121.5 | 100.6 | 211.2 | 262.5 | 343.2 | 404.0 | 929.6 | 684.4 | 841.2 |
| 2007 | 941.8 | 1,133.2 | 488.1 | NA | 126.4 | 175.2 | 268.0 | 360.9 | 476.3 | 610.2 | 541.1 | 944.6 |
| 2008 | 1,167.3 | 1,116.8 | 602.7 | 339.1 | 198.7 | 250.1 | 315.7 | 348.9 | 361.3 | 1,355.3 | 1,381.6 | 1,251.4 |
| 2009 | 1,228.5 | 784.5 | 564.9 | 297.2 | 189.6 | 285.9 | 356.0 | 379.5 | 412.8 | 1,298.6 | 2,716.6 | 1,365.0 |
| 2010 | 1,063.0 | 981.0 | 543.1 | 205.5 | 149.5 | 196.5 | 309.8 | 405.0 | 618.8 | 417.2 | 496.2 | 1,095.0 |
| 2011 | 1,099.9 | 953.3 | 594.4 | 305.2 | 191.7 | 210.3 | 242.6 | 418.5 | 643.4 | 705.0 | 567.3 | 865.7 |
| 2012 | 944.0 | 770.4 | 377.2 | 184.3 | 117.2 | 192.0 | 239.2 | 413.6 | 720.4 | 613.9 | 596.2 | 831.5 |
| 2013 | 1,069.4 | 985.2 | 699.3 | 381.4 | 163.9 | 208.4 | 283.9 | 396.0 | 453.0 | 1,924.3 | 1,183.7 | 1,244.4 |
| 2014 | 1,261.6 | 742.9 | 655.6 | 430.3 | 235.3 | 276.7 | 402.5 | 457.4 | 558.4 | 1,375.7 | 1,134.1 | 864.4 |
| 2015 | 1,029.7 | 944.7 | 475.2 | 218.7 | 143.5 | 222.8 | 267.9 | 348.4 | 448.0 | 682.2 | 378.1 | 628.5 |
| 2016 | 983.3 | 709.0 | 372.2 | 245.7 | 121.9 | W | 181.3 | 321.2 | 400.1 | 965.4 | 460.8 | 961.6 |
| 2017 | 898.6 | 607.0 | 478.0 | 232.7 | 134.3 | 151.6 | 189.8 | 324.4 | 368.6 | 939.5 | 1,305.3 | 902.3 |
| 2018 | 1,281.3 | 928.0 | 606.2 | 462.3 | 111.6 | 191.5 | 274.4 | 374.3 | 414.5 | 1,133.0 | 1,036.6 | 820.6 |
| 2019 | 1,059.8 | 1,209.4 | 597.7 | 219.4 | 179.5 | 233.9 | 260.0 | 289.1 | 267.6 | 955.0 | 1,391.0 | 854.8 |
| 2020 | 758.9 | 610.3 | 331.8 | 252.7 | W | W | W | W | W | W | W | W |
| 2021 | W | W | W | W | W | W | W | W | W | W | W | W |
| 2022 | W | W | W | |||||||||
| - = No Data Reported; -- = Not Applicable; NA = Not Available; W = Withheld to avoid disclosure of individual company data. |
| Release Date: 6/1/2022 |
| Next Release Date: TBD |