|
Download Data (XLS File) |
|
||||||||
|
||||||||
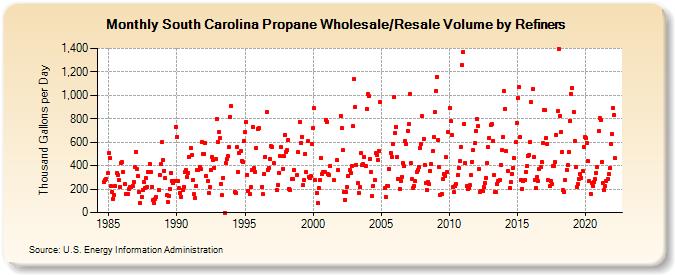
| South Carolina Propane Wholesale/Resale Volume by Refiners (Thousand Gallons per Day) | ||||||||
| Year | Jan | Feb | Mar | Apr | May | Jun | Jul | Aug | Sep | Oct | Nov | Dec |
|---|---|---|---|---|---|---|---|---|---|---|---|---|
| 1984 | 259.3 | 276.3 | 289.8 | 333.4 | ||||||||
| 1985 | 506.2 | 463.7 | 223.3 | 173.5 | 115.9 | 151.0 | 224.8 | 333.3 | 323.2 | 277.5 | 222.2 | 419.2 |
| 1986 | 427.7 | 344.6 | 242.6 | 159.9 | W | 158.4 | 198.3 | 216.3 | 214.7 | 229.0 | 262.5 | 386.3 |
| 1987 | 519.6 | 367.7 | 313.5 | 172.6 | 82.4 | 136.1 | 195.2 | 257.9 | 205.6 | 292.4 | 220.0 | 347.5 |
| 1988 | 417.5 | 341.7 | 219.6 | 104.7 | 84.8 | 118.3 | 132.9 | W | 195.9 | 323.1 | 411.2 | 597.6 |
| 1989 | 446.6 | 356.9 | 295.8 | 147.2 | 91.1 | 142.5 | 204.6 | 341.3 | 272.9 | 251.5 | 267.6 | 733.3 |
| 1990 | 646.7 | 270.6 | 205.5 | 168.6 | 135.0 | 191.4 | 219.4 | 342.7 | 363.2 | 300.1 | 338.6 | 476.8 |
| 1991 | 550.7 | 488.1 | 274.4 | 155.8 | 124.4 | 222.7 | 362.1 | 363.0 | 386.1 | 370.7 | 599.9 | 498.3 |
| 1992 | 497.9 | 591.8 | 311.6 | 268.2 | 170.5 | 217.0 | 366.9 | 474.2 | 452.1 | 383.4 | 453.5 | 796.7 |
| 1993 | 603.5 | 689.9 | 636.4 | 246.3 | 148.6 | 297.4 | 0.0 | 422.0 | 460.1 | 478.5 | 555.9 | 818.8 |
| 1994 | 907.5 | W | W | 174.1 | 170.5 | 556.5 | 346.8 | 505.1 | 523.7 | 439.8 | 435.4 | 606.9 |
| 1995 | 683.1 | 773.2 | 318.8 | 183.8 | 155.9 | 215.4 | 365.8 | 730.0 | 376.3 | 348.4 | 552.0 | 715.2 |
| 1996 | 719.4 | W | W | 221.4 | 155.3 | 326.8 | 474.5 | 855.2 | 367.2 | 379.7 | 458.5 | 564.0 |
| 1997 | 559.7 | 420.3 | W | W | 192.3 | 237.0 | 341.6 | 482.0 | 555.8 | 370.9 | 479.1 | 661.2 |
| 1998 | 520.5 | 531.9 | 620.1 | 203.8 | 191.9 | 284.7 | 287.9 | 366.3 | W | W | 322.1 | 514.9 |
| 1999 | 774.9 | 597.3 | 647.1 | 232.4 | 273.6 | 503.3 | 348.2 | 606.4 | 305.2 | 298.0 | 309.2 | 582.7 |
| 2000 | 722.2 | 888.9 | 274.6 | 169.1 | 81.9 | 205.4 | 277.9 | 466.7 | 325.8 | 348.3 | 347.4 | 790.2 |
| 2001 | 774.0 | 327.4 | 319.7 | 396.6 | W | W | 278.2 | W | W | 448.0 | 363.6 | NA |
| 2002 | 826.2 | 720.1 | 529.3 | 174.1 | 111.2 | 174.9 | 215.0 | 313.7 | 362.3 | 337.7 | 399.5 | 734.0 |
| 2003 | 1,139.5 | 901.2 | 406.8 | 251.8 | 169.8 | 219.8 | 503.8 | 404.9 | 411.6 | 472.9 | 395.2 | 886.4 |
| 2004 | 1,007.1 | 993.3 | 456.8 | 341.7 | 140.8 | 230.1 | 273.7 | 507.3 | 486.7 | 450.6 | 522.7 | 943.3 |
| 2005 | NA | NA | NA | 208.5 | 131.0 | 226.5 | 225.8 | 369.8 | 511.8 | 476.7 | 586.0 | 982.0 |
| 2006 | 680.9 | 732.8 | 472.5 | 288.8 | 203.0 | 265.0 | 304.1 | 420.8 | 393.4 | 608.9 | 588.1 | 696.0 |
| 2007 | 752.9 | 1,009.2 | 418.5 | 287.6 | 210.5 | 224.7 | 266.1 | 345.3 | 364.9 | 391.9 | 551.8 | 587.5 |
| 2008 | 822.6 | 631.2 | 407.3 | 250.0 | 194.1 | 257.2 | 242.4 | 354.5 | 415.7 | 522.4 | 644.2 | 855.4 |
| 2009 | 1,040.4 | 1,158.8 | 619.3 | 388.7 | 149.2 | 160.8 | 287.1 | 329.8 | 312.9 | 470.3 | 347.7 | 687.6 |
| 2010 | 895.9 | 777.7 | 663.3 | 213.9 | 172.7 | 225.9 | 243.4 | 319.9 | 381.6 | 435.7 | 561.0 | 1,259.1 |
| 2011 | 1,369.3 | 756.6 | 418.6 | 223.3 | 197.8 | 207.3 | 232.8 | 318.4 | 435.2 | 531.6 | 589.2 | 695.9 |
| 2012 | 797.3 | 736.9 | 372.2 | 179.3 | 183.7 | 182.5 | 216.9 | 253.1 | 297.8 | 425.2 | 555.2 | 637.4 |
| 2013 | 744.0 | 756.0 | 612.9 | 318.2 | 176.1 | 173.5 | 241.4 | 267.6 | 279.9 | 406.5 | 530.3 | 645.6 |
| 2014 | 1,032.8 | 887.3 | 523.5 | 354.1 | W | 211.7 | 259.9 | 330.6 | 383.7 | 462.8 | 597.9 | 767.9 |
| 2015 | 976.3 | 1,072.3 | 642.1 | 277.6 | 202.2 | 270.0 | 277.7 | 349.9 | 398.8 | 485.4 | 490.5 | 600.6 |
| 2016 | 938.8 | 1,050.2 | 474.9 | 278.4 | 210.6 | 299.5 | 269.1 | 375.0 | 389.9 | 432.8 | 590.4 | 876.2 |
| 2017 | 872.3 | 639.9 | 585.6 | 275.2 | 224.7 | 268.7 | 241.4 | 394.1 | 399.2 | 432.6 | 661.4 | 864.9 |
| 2018 | 1,397.8 | 821.3 | 684.4 | 516.0 | 188.8 | 178.1 | 279.7 | 365.3 | 401.5 | 517.8 | 781.8 | 1,012.3 |
| 2019 | 1,064.6 | 860.7 | 606.2 | 389.6 | 221.1 | 242.6 | 284.9 | 328.2 | 296.5 | 350.4 | 557.6 | 646.2 |
| 2020 | 632.4 | 591.2 | 435.9 | 266.6 | 160.6 | 252.4 | 225.6 | 263.1 | 284.2 | 339.9 | 389.7 | 694.6 |
| 2021 | 808.1 | 793.3 | 431.9 | 255.9 | 195.3 | 227.0 | 268.3 | 283.2 | 328.8 | 378.2 | 586.3 | 669.2 |
| 2022 | 894.6 | 832.6 | 462.5 | |||||||||
| - = No Data Reported; -- = Not Applicable; NA = Not Available; W = Withheld to avoid disclosure of individual company data. |
| Release Date: 6/1/2022 |
| Next Release Date: TBD |