|
Download Data (XLS File) |
|
||||||||
|
||||||||
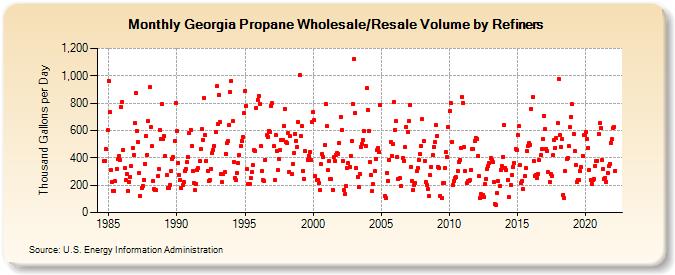
| Georgia Propane Wholesale/Resale Volume by Refiners (Thousand Gallons per Day) | ||||||||
| Year | Jan | Feb | Mar | Apr | May | Jun | Jul | Aug | Sep | Oct | Nov | Dec |
|---|---|---|---|---|---|---|---|---|---|---|---|---|
| 1984 | 378.7 | 378.5 | 462.2 | 600.7 | ||||||||
| 1985 | 964.5 | 732.1 | 308.6 | 222.5 | 159.7 | 159.6 | 228.4 | 320.4 | 389.0 | 413.4 | 385.1 | 771.5 |
| 1986 | 810.0 | 459.4 | 324.5 | 237.8 | 282.5 | 158.7 | 226.6 | 262.6 | 338.3 | 474.0 | 422.4 | 654.4 |
| 1987 | 874.4 | 598.1 | 514.5 | 290.2 | 124.5 | 182.3 | 196.8 | 239.9 | 358.6 | 560.0 | 422.7 | 667.9 |
| 1988 | 915.1 | 622.4 | 486.2 | 229.3 | 173.6 | 164.5 | 162.7 | 263.7 | 316.1 | 601.6 | 540.3 | 790.1 |
| 1989 | 540.4 | 556.5 | 414.6 | 270.9 | 181.3 | 182.8 | 203.6 | 303.5 | 394.1 | 404.3 | 521.1 | 804.0 |
| 1990 | 597.6 | 365.9 | 273.7 | 237.1 | 175.9 | 198.0 | 223.7 | 305.8 | 318.5 | 366.8 | 405.1 | 581.4 |
| 1991 | 606.8 | 487.5 | 305.4 | 219.1 | 161.8 | 208.8 | 309.5 | 323.1 | 376.2 | 461.8 | 608.1 | 532.7 |
| 1992 | 835.2 | 566.5 | 379.4 | 305.8 | 229.1 | 238.4 | 320.6 | 433.8 | 460.2 | 487.6 | 588.2 | 922.4 |
| 1993 | 645.9 | 862.5 | 659.7 | 284.5 | 220.9 | 283.0 | 296.1 | 430.7 | 506.7 | 521.5 | 641.0 | 880.1 |
| 1994 | 962.7 | 666.1 | 370.5 | 252.4 | 238.0 | 288.1 | 361.1 | 417.2 | 485.7 | 520.3 | 553.1 | 724.4 |
| 1995 | 888.2 | 780.2 | 315.5 | 210.8 | 207.7 | 253.1 | 296.2 | 345.5 | 454.5 | 451.4 | 764.2 | 826.2 |
| 1996 | 853.1 | 793.9 | 484.9 | 304.8 | 234.6 | 230.1 | 385.7 | 565.9 | 552.5 | 597.2 | 590.9 | 779.1 |
| 1997 | 798.2 | 484.3 | 236.2 | 565.1 | 448.9 | 309.5 | 394.5 | 460.7 | 530.8 | 527.8 | 632.8 | 759.5 |
| 1998 | 514.7 | 510.9 | 579.4 | 299.0 | 556.7 | 281.2 | 356.5 | 437.4 | 576.4 | 522.2 | 482.2 | 661.7 |
| 1999 | 1,003.0 | 561.6 | 632.5 | 306.7 | 248.5 | 448.1 | W | 386.8 | 416.6 | 443.1 | 387.1 | 663.0 |
| 2000 | 731.5 | 674.4 | 267.2 | 239.2 | 237.9 | 218.2 | 167.9 | 352.1 | 426.7 | 404.9 | 494.2 | 792.1 |
| 2001 | 631.3 | 310.1 | 375.5 | 243.6 | 242.8 | 168.4 | 405.7 | 379.2 | 423.8 | 436.8 | 430.6 | 508.4 |
| 2002 | 699.3 | 604.8 | 378.7 | 161.4 | 134.4 | 193.0 | 325.8 | 362.5 | 334.7 | 415.6 | 522.2 | 792.8 |
| 2003 | 1,122.6 | 728.8 | 327.3 | 263.0 | 186.9 | 283.1 | 479.1 | 504.0 | 531.7 | 594.4 | 488.4 | 907.3 |
| 2004 | 749.7 | 599.8 | 371.9 | 276.2 | 157.0 | 206.2 | 300.6 | 393.6 | 454.0 | 471.2 | 443.8 | 784.7 |
| 2005 | NA | NA | NA | 122.7 | 109.2 | 291.7 | 232.8 | 383.1 | 516.6 | 414.8 | 497.8 | 809.1 |
| 2006 | 604.3 | 665.8 | 409.4 | 245.3 | 249.0 | 190.5 | W | 397.9 | 380.1 | 476.6 | 626.8 | 590.3 |
| 2007 | 670.1 | 785.8 | 336.6 | 229.2 | 167.4 | 199.0 | 216.1 | 300.3 | 326.1 | 385.0 | 425.9 | 486.7 |
| 2008 | 681.1 | 523.9 | 377.7 | 220.0 | 200.0 | 171.4 | 119.3 | 273.8 | 336.3 | 419.7 | 479.3 | 516.7 |
| 2009 | 638.4 | 561.8 | 335.0 | 326.8 | 123.8 | 103.7 | 217.8 | 218.2 | 329.0 | 440.0 | 405.9 | 622.8 |
| 2010 | 740.5 | 800.5 | 517.4 | 204.1 | 228.0 | 253.0 | 257.2 | 307.0 | 369.9 | 385.8 | 470.7 | 846.0 |
| 2011 | 803.6 | 479.0 | 303.6 | 212.6 | 227.1 | 231.1 | 234.4 | 314.0 | 467.5 | 462.4 | 524.0 | 548.3 |
| 2012 | 536.4 | 413.8 | 264.6 | 104.9 | 132.4 | 125.0 | 112.0 | 206.1 | 246.8 | 318.4 | 339.1 | 364.7 |
| 2013 | 398.0 | 384.8 | 367.8 | 223.0 | 62.0 | 58.4 | 140.8 | 229.4 | 191.0 | 314.4 | 338.5 | 408.9 |
| 2014 | 642.6 | 326.5 | 310.4 | 237.6 | 112.9 | W | 205.0 | 275.2 | 332.4 | 365.1 | 465.2 | 458.3 |
| 2015 | 564.9 | 632.1 | 344.4 | 214.0 | 230.6 | 169.1 | 266.5 | 324.4 | 447.4 | 487.0 | 510.4 | 496.2 |
| 2016 | 757.6 | 843.2 | 375.5 | 267.5 | 276.8 | 251.5 | 280.8 | 380.6 | 418.8 | 464.2 | 535.1 | 709.4 |
| 2017 | 609.3 | 463.2 | 450.8 | 293.6 | 225.5 | 279.2 | 266.0 | 419.3 | 529.9 | 474.1 | 544.1 | 651.9 |
| 2018 | 973.3 | 564.8 | 481.6 | 536.0 | 128.5 | 104.0 | 300.5 | 388.4 | 398.0 | 483.0 | 623.0 | 700.5 |
| 2019 | 791.3 | 577.2 | 447.7 | 351.0 | 224.6 | 240.4 | 235.5 | 300.8 | 331.1 | 411.3 | 564.9 | 563.4 |
| 2020 | 587.6 | 534.1 | 474.6 | 313.3 | 237.2 | 208.9 | 238.4 | 245.7 | 343.0 | 374.0 | 380.3 | 575.5 |
| 2021 | 654.2 | 618.6 | 381.5 | 320.1 | 248.1 | 252.9 | 226.1 | 287.6 | 339.3 | 358.5 | 511.1 | 535.2 |
| 2022 | 619.9 | 626.5 | 307.3 | |||||||||
| - = No Data Reported; -- = Not Applicable; NA = Not Available; W = Withheld to avoid disclosure of individual company data. |
| Release Date: 6/1/2022 |
| Next Release Date: TBD |