|
Download Data (XLS File) |
|
||||||||
|
||||||||
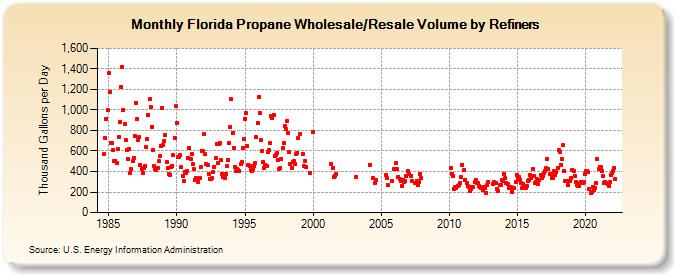
| Florida Propane Wholesale/Resale Volume by Refiners (Thousand Gallons per Day) | ||||||||
| Year | Jan | Feb | Mar | Apr | May | Jun | Jul | Aug | Sep | Oct | Nov | Dec |
|---|---|---|---|---|---|---|---|---|---|---|---|---|
| 1984 | 571.1 | 730.1 | 913.7 | 996.9 | ||||||||
| 1985 | 1,356.4 | 1,173.4 | 679.1 | 674.6 | 613.9 | 504.3 | 505.5 | 484.3 | 621.8 | 734.8 | 880.4 | 1,225.5 |
| 1986 | 1,421.7 | 1,000.9 | 864.5 | 702.3 | 605.0 | 518.0 | 620.6 | 387.4 | 420.1 | 499.2 | 535.2 | 742.7 |
| 1987 | 1,069.9 | 908.2 | 709.8 | 732.7 | 463.8 | 420.6 | 389.9 | 434.6 | 454.9 | 641.4 | 717.2 | 952.0 |
| 1988 | 1,105.6 | 1,033.4 | 837.4 | 609.5 | 453.1 | 424.9 | 412.3 | 437.1 | 506.5 | 547.0 | 649.8 | 1,020.3 |
| 1989 | 662.3 | 697.9 | 752.5 | 488.3 | 433.7 | 378.2 | 364.5 | 443.3 | 458.1 | 556.4 | 726.6 | 1,036.4 |
| 1990 | 876.4 | 544.4 | 538.0 | 556.8 | 439.9 | 352.6 | 307.4 | 396.6 | 383.7 | 404.0 | 534.7 | 627.0 |
| 1991 | 523.8 | 569.9 | 469.3 | 421.4 | 314.4 | 339.3 | 319.1 | 299.8 | 336.0 | 443.6 | 604.0 | 598.3 |
| 1992 | 770.3 | 568.2 | 475.2 | 468.0 | 379.9 | 329.5 | 327.1 | 332.0 | 397.1 | 446.7 | 530.1 | 672.6 |
| 1993 | 480.0 | 664.5 | 674.8 | 507.4 | 375.9 | 351.1 | 335.8 | 378.5 | 452.0 | 513.0 | 676.6 | 836.6 |
| 1994 | 1,103.3 | 773.0 | 630.1 | 448.6 | 407.1 | 425.0 | 414.4 | 404.5 | 475.5 | 493.9 | 631.4 | 720.4 |
| 1995 | 915.9 | 966.4 | 646.2 | 463.2 | 456.9 | 411.5 | 401.6 | 428.7 | 455.1 | 485.3 | 734.1 | 868.2 |
| 1996 | 1,129.5 | 974.5 | 707.5 | 599.9 | 493.9 | 430.5 | 467.8 | 453.5 | 588.8 | 609.1 | 673.1 | 940.5 |
| 1997 | 918.4 | 953.3 | 550.8 | 565.7 | 578.7 | 509.9 | 420.6 | 438.9 | 520.7 | 626.8 | 679.8 | 840.6 |
| 1998 | 817.7 | 895.8 | 775.2 | 590.4 | 474.3 | 438.1 | 494.0 | 505.2 | 476.4 | 567.3 | 583.6 | 722.9 |
| 1999 | 761.0 | W | W | 572.2 | 450.7 | 500.6 | 441.1 | W | W | 388.0 | W | W |
| 2000 | 783.3 | W | W | W | W | W | W | W | W | W | W | W |
| 2001 | W | W | W | W | 472.4 | 436.4 | 346.4 | 358.1 | 371.4 | W | W | W |
| 2002 | W | W | W | W | W | W | W | W | W | W | W | W |
| 2003 | W | W | 350.4 | W | W | W | W | W | W | W | W | W |
| 2004 | W | W | 466.5 | W | W | 334.3 | 288.5 | 315.8 | W | W | W | W |
| 2005 | NA | NA | NA | W | 362.6 | 333.4 | 269.4 | W | W | 304.2 | W | 423.8 |
| 2006 | W | 478.8 | 420.0 | 350.4 | 330.8 | 303.5 | 263.3 | 317.8 | 302.2 | 304.0 | 352.4 | 405.0 |
| 2007 | 380.1 | W | 359.5 | 311.1 | W | W | 287.2 | 311.7 | 273.0 | 293.1 | 377.9 | 337.9 |
| 2008 | W | W | W | W | W | W | W | W | W | W | W | W |
| 2009 | W | W | W | W | W | W | W | W | W | W | W | W |
| 2010 | W | 437.5 | 378.3 | 352.6 | 232.1 | 245.7 | 240.7 | 259.2 | 264.4 | 290.5 | 348.4 | 468.1 |
| 2011 | W | 412.8 | 321.0 | 291.0 | 259.0 | 249.5 | 209.8 | 224.8 | 245.0 | 245.0 | 297.2 | 317.6 |
| 2012 | 283.8 | 285.6 | 258.3 | 251.6 | 234.5 | 222.9 | 247.7 | 239.0 | 195.3 | 270.7 | 299.8 | W |
| 2013 | W | W | 279.4 | 293.8 | 285.1 | 286.0 | 230.0 | 209.5 | 270.9 | 269.6 | 315.7 | 309.7 |
| 2014 | 376.2 | 341.6 | 285.9 | 282.6 | 242.9 | 244.0 | 248.5 | 202.6 | 242.8 | 239.1 | 293.1 | 368.7 |
| 2015 | 334.0 | 347.8 | 318.8 | 284.2 | 240.8 | 275.0 | 249.4 | 238.8 | 263.4 | 308.1 | 314.5 | 362.3 |
| 2016 | 340.2 | 426.8 | 354.8 | 289.6 | 295.5 | 322.4 | 274.1 | 318.8 | 367.2 | 338.5 | 357.6 | 390.4 |
| 2017 | 407.0 | 433.9 | 522.4 | 422.3 | 375.3 | 373.8 | 339.0 | 338.7 | 402.2 | 364.9 | 396.9 | 433.4 |
| 2018 | 611.1 | 594.8 | 467.5 | 521.6 | 653.7 | 403.8 | 310.9 | 306.8 | 264.9 | 307.8 | 312.0 | 340.4 |
| 2019 | 417.9 | 409.6 | 360.1 | 294.5 | 272.2 | 261.9 | 262.7 | 284.2 | 299.9 | 285.7 | 302.2 | 380.2 |
| 2020 | 400.9 | 409.1 | 391.2 | 229.4 | 187.0 | 203.0 | 250.5 | 215.1 | 243.5 | 287.5 | 520.4 | 421.3 |
| 2021 | 445.9 | 447.1 | 407.3 | 353.6 | 289.6 | 301.4 | 283.8 | 275.5 | 260.4 | 296.8 | 370.5 | 386.7 |
| 2022 | 402.7 | 435.6 | 324.8 | |||||||||
| - = No Data Reported; -- = Not Applicable; NA = Not Available; W = Withheld to avoid disclosure of individual company data. |
| Release Date: 6/1/2022 |
| Next Release Date: TBD |