|
Download Data (XLS File) |
|
||||||||
|
||||||||
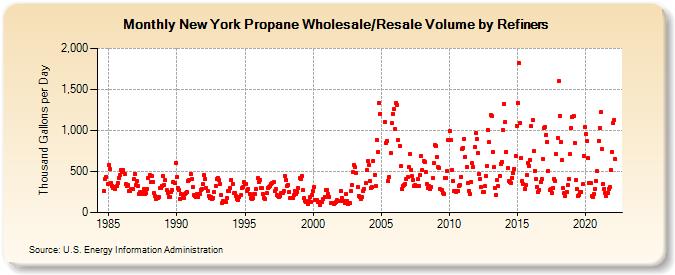
| New York Propane Wholesale/Resale Volume by Refiners (Thousand Gallons per Day) | ||||||||
| Year | Jan | Feb | Mar | Apr | May | Jun | Jul | Aug | Sep | Oct | Nov | Dec |
|---|---|---|---|---|---|---|---|---|---|---|---|---|
| 1984 | 259.8 | 404.5 | 436.8 | 350.1 | ||||||||
| 1985 | 580.0 | 529.7 | 364.3 | 327.6 | 300.2 | 312.4 | 281.0 | 321.5 | 357.5 | 426.5 | 455.2 | 516.9 |
| 1986 | 488.2 | 517.1 | 464.5 | 346.4 | 319.6 | 334.2 | 259.5 | 261.1 | 286.9 | 290.2 | 404.9 | 475.6 |
| 1987 | 337.6 | 378.4 | 318.1 | 229.4 | 256.0 | 224.3 | 241.7 | 282.6 | 232.1 | 234.0 | 281.6 | 419.3 |
| 1988 | 456.3 | 369.4 | 448.4 | 373.3 | 238.0 | 196.2 | 160.7 | 173.4 | 192.1 | 305.0 | 297.5 | 329.2 |
| 1989 | 440.6 | 339.6 | 393.7 | 273.5 | 239.5 | 194.3 | 193.6 | 249.3 | 277.0 | 378.3 | 362.2 | 607.8 |
| 1990 | 436.1 | 298.7 | 269.9 | 162.8 | 221.5 | 187.4 | 182.9 | 228.2 | 243.7 | 246.2 | 387.9 | 396.9 |
| 1991 | 471.2 | 409.2 | 314.1 | 215.8 | 206.4 | 185.9 | 227.6 | 190.2 | 220.7 | 272.1 | 290.5 | 346.5 |
| 1992 | 453.1 | 414.3 | 298.1 | 261.1 | 206.6 | 171.9 | 184.4 | 160.9 | 182.7 | 245.4 | 329.5 | 406.6 |
| 1993 | 422.8 | 395.1 | 348.6 | 213.3 | 119.8 | 143.5 | 131.3 | 126.3 | 180.6 | 268.2 | 257.9 | 300.0 |
| 1994 | 400.4 | 354.0 | 234.8 | 240.7 | 202.1 | 166.3 | 157.5 | 185.8 | 208.2 | 293.9 | 309.8 | 371.8 |
| 1995 | 352.5 | 349.2 | 260.7 | 287.4 | 229.7 | 171.5 | 166.7 | 173.8 | 220.9 | 224.2 | 284.6 | 415.3 |
| 1996 | 370.4 | 394.8 | 301.9 | 297.2 | 220.1 | 175.6 | 164.0 | 236.4 | 304.3 | 317.2 | 326.5 | 347.3 |
| 1997 | 355.6 | 368.1 | 262.2 | 290.0 | 216.1 | 199.2 | 185.3 | 195.9 | 233.7 | 235.6 | 258.1 | 447.7 |
| 1998 | 401.7 | 326.7 | 339.0 | 255.5 | 178.3 | 173.8 | 182.5 | 216.7 | 262.6 | 224.4 | 255.1 | 298.5 |
| 1999 | 415.1 | 403.0 | 450.5 | 271.5 | 171.3 | 143.5 | 127.1 | 102.4 | 145.9 | 185.3 | 130.2 | 207.9 |
| 2000 | 260.2 | 307.4 | 157.7 | 149.4 | 130.9 | 124.8 | 92.5 | 130.7 | 134.2 | 160.2 | 193.9 | 269.0 |
| 2001 | 278.5 | 223.5 | 191.6 | W | 114.8 | 111.9 | 108.0 | 115.2 | 124.3 | 147.9 | 144.3 | 140.7 |
| 2002 | 268.4 | 180.6 | 141.5 | 144.7 | 121.0 | 224.3 | 142.9 | 104.9 | 118.3 | 264.9 | 333.1 | 490.4 |
| 2003 | 577.5 | 550.9 | 485.4 | 312.5 | 204.1 | 188.2 | 167.7 | 191.4 | 267.5 | 291.0 | 359.7 | 517.3 |
| 2004 | 629.8 | 578.3 | 389.0 | 293.9 | 305.7 | 631.3 | 463.3 | 321.8 | 889.6 | 737.5 | 1,336.1 | 1,205.2 |
| 2005 | NA | NA | NA | 1,107.5 | 850.1 | 872.8 | 380.6 | 428.7 | 721.4 | 1,086.4 | 1,202.7 | 1,256.4 |
| 2006 | 1,018.5 | 1,339.5 | 1,315.6 | 885.2 | 816.7 | 563.4 | 286.7 | 319.5 | 332.9 | 349.3 | 404.8 | 428.7 |
| 2007 | 553.8 | 710.5 | 520.0 | 440.6 | 397.9 | 325.3 | 335.7 | 321.0 | 403.6 | 325.5 | 463.6 | 688.1 |
| 2008 | 524.2 | 630.6 | 618.7 | 492.6 | 349.9 | 298.4 | 322.4 | 281.7 | 317.3 | 423.1 | 597.8 | 819.8 |
| 2009 | 813.6 | 678.4 | 553.1 | 546.0 | 283.9 | 278.2 | 242.4 | 231.1 | 426.2 | 422.9 | 506.1 | 884.0 |
| 2010 | 993.4 | 878.0 | 514.6 | 387.4 | 258.0 | 258.5 | 251.5 | 264.5 | 329.1 | 338.9 | 435.2 | 769.0 |
| 2011 | 791.3 | 896.6 | 682.5 | 551.9 | 360.3 | 265.5 | 228.3 | 373.8 | 599.6 | 553.0 | 796.3 | 972.0 |
| 2012 | 896.4 | 721.2 | 470.8 | 410.5 | 305.9 | 246.4 | 252.8 | 319.8 | 448.1 | 564.2 | 1,000.8 | 854.4 |
| 2013 | 1,185.7 | 1,177.2 | 741.1 | 551.6 | 300.9 | 213.7 | 398.1 | 318.8 | 447.9 | 594.3 | 620.7 | 1,008.3 |
| 2014 | 1,324.7 | 1,101.0 | 741.7 | 540.6 | 383.7 | 366.8 | 358.1 | 422.8 | 483.9 | 532.0 | 690.5 | 1,055.4 |
| 2015 | 1,340.2 | 1,818.1 | 1,090.5 | 667.1 | 383.7 | 346.5 | 291.1 | 332.2 | 452.2 | 598.0 | 571.5 | 645.1 |
| 2016 | 1,052.8 | 1,126.6 | 750.5 | 511.7 | 412.4 | 317.2 | 249.9 | 280.5 | 371.2 | 402.9 | 657.4 | 1,035.6 |
| 2017 | 1,047.9 | 950.8 | 865.5 | 510.8 | 273.5 | 284.9 | 243.2 | 299.8 | 413.0 | 385.8 | 713.8 | 912.5 |
| 2018 | 1,601.5 | 1,179.4 | 859.4 | 642.0 | 300.6 | 234.8 | 204.6 | 250.7 | 335.1 | 405.6 | 708.4 | 1,033.0 |
| 2019 | 1,166.7 | 1,182.2 | 850.8 | 399.6 | 292.9 | 206.6 | 217.1 | 250.4 | 253.7 | 346.7 | 689.5 | 1,043.8 |
| 2020 | 956.7 | 866.0 | 658.9 | 356.1 | 358.5 | 197.7 | 190.0 | 227.0 | 285.6 | 389.9 | 500.5 | 877.4 |
| 2021 | 1,027.7 | 1,220.8 | 773.9 | 348.6 | 290.3 | 243.9 | 201.8 | 243.9 | 291.4 | 306.3 | 523.6 | 738.9 |
| 2022 | 1,085.7 | 1,128.3 | 650.1 | |||||||||
| - = No Data Reported; -- = Not Applicable; NA = Not Available; W = Withheld to avoid disclosure of individual company data. |
| Release Date: 6/1/2022 |
| Next Release Date: TBD |