|
Download Data (XLS File) |
|
||||||||
|
||||||||
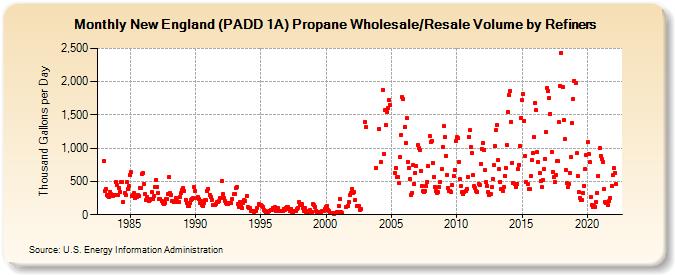
| New England (PADD 1A) Propane Wholesale/Resale Volume by Refiners (Thousand Gallons per Day) | ||||||||
| Year | Jan | Feb | Mar | Apr | May | Jun | Jul | Aug | Sep | Oct | Nov | Dec |
|---|---|---|---|---|---|---|---|---|---|---|---|---|
| 1983 | 809.3 | 362.4 | 381.8 | 290.8 | 277.8 | 272.7 | 346.4 | 304.4 | 281.3 | 298.8 | 291.0 | 489.2 |
| 1984 | 440.5 | 297.9 | 394.8 | 345.2 | 498.9 | 494.1 | 193.4 | 327.1 | 294.8 | 490.9 | 379.6 | 426.9 |
| 1985 | 590.7 | 634.9 | 282.3 | 292.1 | 324.8 | 258.0 | 270.4 | 298.1 | 287.9 | 405.8 | 407.1 | 615.4 |
| 1986 | 620.3 | 458.9 | 307.8 | 225.3 | 265.8 | 205.4 | 225.6 | 236.4 | 337.2 | 243.5 | 281.1 | 418.0 |
| 1987 | 528.4 | 418.3 | 329.2 | 234.1 | 231.3 | 208.1 | 177.6 | 162.8 | 182.7 | 236.6 | 236.6 | 306.4 |
| 1988 | 567.4 | 328.9 | 295.5 | 206.3 | 198.3 | 198.1 | 245.1 | 208.1 | 188.6 | 193.7 | 270.0 | 327.4 |
| 1989 | 370.4 | 399.4 | 358.6 | 226.7 | 180.4 | 128.6 | 129.4 | 172.8 | 215.8 | 242.9 | 245.2 | 417.7 |
| 1990 | 357.8 | 252.4 | 263.6 | 232.0 | 172.9 | 205.0 | 146.4 | 137.5 | 170.2 | 215.3 | 214.8 | 350.4 |
| 1991 | 393.4 | 302.1 | 265.4 | 224.4 | 139.6 | 152.0 | 147.3 | 160.3 | 189.6 | 195.9 | 203.8 | 254.9 |
| 1992 | 503.4 | 310.4 | 257.4 | 208.6 | 179.7 | 164.6 | 155.6 | 171.9 | 172.6 | 178.9 | 236.8 | 306.8 |
| 1993 | 308.7 | 394.3 | 413.0 | 161.2 | 123.4 | 197.9 | 127.9 | 102.7 | 182.7 | 219.5 | 208.1 | 287.1 |
| 1994 | 120.4 | 105.8 | 94.2 | 62.3 | 49.5 | 61.0 | 45.8 | 48.9 | 61.2 | 106.8 | 159.3 | 144.7 |
| 1995 | 143.1 | 133.6 | 119.3 | 67.9 | 61.0 | 38.1 | 44.4 | 43.8 | 54.4 | 78.2 | 74.1 | 103.3 |
| 1996 | 107.5 | 111.0 | 57.8 | 78.0 | 95.5 | 60.9 | 56.7 | 61.1 | 53.7 | 89.9 | 70.8 | 108.4 |
| 1997 | 121.3 | 109.7 | 89.2 | 54.0 | 91.1 | 48.3 | 42.9 | 53.2 | 60.2 | 84.4 | 107.6 | 193.7 |
| 1998 | 147.5 | 157.0 | 156.5 | 93.6 | 60.4 | 94.1 | 48.0 | 49.5 | 47.6 | 65.5 | 34.2 | 41.5 |
| 1999 | 159.7 | 141.1 | 118.9 | 63.0 | 45.5 | 44.5 | 27.6 | 34.9 | 50.9 | 56.6 | 61.6 | 82.2 |
| 2000 | 113.8 | 132.0 | 77.8 | 48.7 | 23.5 | 20.7 | 31.8 | 14.5 | W | 22.5 | 42.3 | 38.8 |
| 2001 | 130.0 | 239.2 | 42.6 | 22.1 | W | W | 110.3 | W | 134.9 | 197.7 | 292.5 | 331.0 |
| 2002 | 393.6 | 331.7 | 335.8 | 225.1 | 132.6 | 130.6 | 129.1 | 76.1 | 87.8 | W | W | W |
| 2003 | 1,395.1 | 1,314.1 | W | W | W | W | W | W | W | W | 706.6 | W |
| 2004 | W | 1,294.2 | 792.2 | W | 1,877.0 | 919.1 | 1,567.5 | 1,348.0 | 1,537.3 | 1,598.5 | 1,729.2 | 1,646.6 |
| 2005 | NA | NA | NA | 632.6 | 702.8 | 565.6 | 561.7 | 478.4 | 863.8 | 1,203.1 | 1,767.9 | 1,733.8 |
| 2006 | 1,317.4 | 1,076.8 | 1,452.2 | 796.8 | 706.5 | 535.8 | 302.4 | 333.1 | 745.0 | 467.9 | 630.5 | 732.3 |
| 2007 | 1,041.1 | 995.6 | 976.1 | 661.1 | 434.1 | 349.8 | 344.1 | 358.6 | 428.6 | 497.6 | 729.6 | 1,177.5 |
| 2008 | 1,091.9 | 1,107.6 | 774.6 | 573.2 | 418.8 | 362.8 | 331.5 | 337.0 | 413.0 | 493.4 | 688.3 | 1,021.8 |
| 2009 | 1,326.0 | 1,167.6 | 886.8 | 603.0 | 400.2 | 359.5 | 354.4 | 337.5 | 446.2 | 580.7 | 665.7 | 1,101.3 |
| 2010 | 1,161.8 | 1,151.3 | 798.4 | 532.8 | 428.5 | 343.1 | 307.5 | 348.8 | 358.8 | 385.4 | 572.3 | 1,173.0 |
| 2011 | 1,268.1 | 1,013.7 | 922.9 | 593.4 | 424.8 | 402.1 | 357.8 | 347.1 | 463.2 | 452.4 | 767.4 | 994.0 |
| 2012 | 1,085.1 | 977.8 | 666.4 | 486.6 | 428.3 | 344.2 | 291.2 | 310.4 | 412.1 | 538.9 | 741.9 | 1,031.2 |
| 2013 | 1,277.0 | 1,345.3 | 820.6 | 681.9 | 496.2 | 383.8 | 353.6 | 409.5 | 588.5 | 708.5 | 1,045.9 | 1,545.4 |
| 2014 | 1,797.3 | 1,854.9 | 1,400.8 | 782.7 | 478.8 | 462.5 | 416.2 | 461.0 | 682.9 | 753.1 | 1,035.1 | 1,457.2 |
| 2015 | 1,719.5 | 1,814.7 | 1,411.1 | 883.5 | 490.0 | 457.5 | 379.3 | 388.3 | 580.2 | 824.0 | 926.4 | 1,169.3 |
| 2016 | 1,683.2 | 1,570.4 | 938.7 | 790.6 | 621.3 | 501.1 | 412.0 | 521.7 | 680.9 | 844.3 | 1,242.0 | 1,908.5 |
| 2017 | 1,861.8 | 1,758.9 | 1,520.0 | 943.3 | 645.2 | 564.3 | 490.8 | 599.5 | 800.0 | 802.2 | 1,386.4 | 1,939.7 |
| 2018 | 2,436.4 | 1,912.3 | 1,420.4 | 1,137.9 | 668.7 | 471.7 | 410.2 | 464.3 | 627.4 | 865.9 | 1,379.7 | 1,745.2 |
| 2019 | 2,014.4 | 1,976.6 | 923.2 | 586.5 | 336.5 | 257.9 | 217.5 | 220.8 | 330.2 | 436.3 | 685.5 | 899.5 |
| 2020 | 1,087.1 | 909.7 | 784.9 | 263.6 | 145.3 | 122.7 | 124.6 | 121.2 | 187.7 | 333.9 | 586.0 | 997.7 |
| 2021 | 889.1 | 833.1 | 793.3 | 384.6 | 195.9 | 171.6 | 181.9 | 144.2 | 207.7 | 254.6 | 433.6 | 592.5 |
| 2022 | 702.1 | 634.5 | 454.2 | |||||||||
| - = No Data Reported; -- = Not Applicable; NA = Not Available; W = Withheld to avoid disclosure of individual company data. |
| Release Date: 6/1/2022 |
| Next Release Date: TBD |