|
Download Data (XLS File) |
|
||||||||
|
||||||||
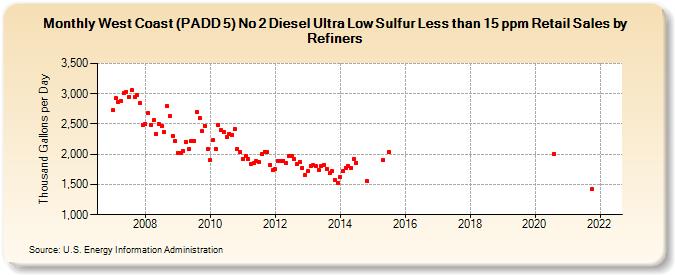
| West Coast (PADD 5) No 2 Diesel Ultra Low Sulfur Less than 15 ppm Retail Sales by Refiners (Thousand Gallons per Day) | ||||||||
| Year | Jan | Feb | Mar | Apr | May | Jun | Jul | Aug | Sep | Oct | Nov | Dec |
|---|---|---|---|---|---|---|---|---|---|---|---|---|
| 2007 | 2,726.1 | 2,922.6 | 2,866.9 | 2,884.4 | 3,014.9 | 3,033.3 | 2,948.0 | 3,061.0 | 2,942.6 | 2,975.2 | 2,839.9 | 2,485.3 |
| 2008 | 2,495.6 | 2,674.5 | 2,490.0 | 2,562.8 | 2,330.8 | 2,506.5 | 2,461.7 | 2,367.6 | 2,796.1 | 2,630.9 | 2,306.9 | 2,216.2 |
| 2009 | 2,025.8 | 2,017.4 | 2,052.9 | 2,209.2 | 2,085.4 | 2,211.3 | 2,222.0 | 2,698.9 | 2,591.0 | 2,381.8 | 2,471.1 | 2,083.4 |
| 2010 | 1,907.3 | 2,233.7 | 2,091.4 | 2,487.6 | 2,392.8 | 2,370.9 | 2,287.2 | 2,342.4 | 2,322.6 | 2,417.1 | 2,092.3 | 2,028.6 |
| 2011 | 1,919.1 | 1,970.8 | 1,927.6 | 1,844.0 | 1,857.8 | 1,886.5 | 1,876.6 | 1,996.0 | 2,042.8 | 2,037.0 | 1,823.5 | 1,734.8 |
| 2012 | 1,753.5 | 1,894.6 | 1,895.9 | 1,894.5 | 1,857.0 | 1,966.6 | 1,975.4 | 1,918.2 | 1,836.4 | 1,873.1 | 1,777.6 | 1,653.7 |
| 2013 | 1,721.3 | 1,811.0 | 1,816.9 | 1,799.1 | 1,738.4 | 1,806.3 | 1,817.7 | 1,762.7 | 1,681.6 | 1,715.2 | 1,580.2 | 1,530.4 |
| 2014 | 1,631.3 | 1,722.0 | 1,771.2 | 1,802.9 | 1,772.4 | 1,922.8 | 1,862.0 | W | W | W | 1,550.0 | W |
| 2015 | W | W | W | W | 1,906.5 | W | 2,043.0 | W | W | W | W | W |
| 2016 | W | W | W | W | W | W | W | W | W | W | W | W |
| 2017 | W | W | W | W | W | W | W | W | W | W | W | W |
| 2018 | W | W | W | W | W | W | W | W | W | W | W | W |
| 2019 | W | W | W | W | W | W | W | W | W | W | W | W |
| 2020 | W | W | W | W | W | W | W | 2,009.7 | W | W | W | W |
| 2021 | W | W | W | W | W | W | W | W | W | 1,418.5 | W | W |
| 2022 | W | W | W | |||||||||
| - = No Data Reported; -- = Not Applicable; NA = Not Available; W = Withheld to avoid disclosure of individual company data. |
| Release Date: 6/1/2022 |
| Next Release Date: TBD |