|
Download Data (XLS File) |
|
||||||||
|
||||||||
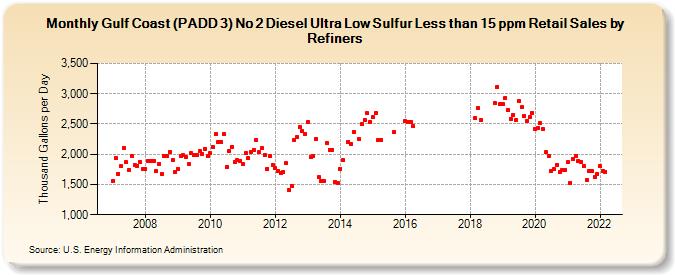
| Gulf Coast (PADD 3) No 2 Diesel Ultra Low Sulfur Less than 15 ppm Retail Sales by Refiners (Thousand Gallons per Day) | ||||||||
| Year | Jan | Feb | Mar | Apr | May | Jun | Jul | Aug | Sep | Oct | Nov | Dec |
|---|---|---|---|---|---|---|---|---|---|---|---|---|
| 2007 | 1,554.8 | 1,929.6 | 1,679.6 | 1,804.6 | 2,095.9 | 1,865.8 | 1,741.2 | 1,962.6 | 1,819.8 | 1,811.6 | 1,873.8 | 1,759.5 |
| 2008 | 1,753.7 | 1,884.3 | 1,881.7 | 1,894.7 | 1,720.7 | 1,843.3 | 1,678.3 | 1,972.6 | 1,978.1 | 2,043.1 | 1,907.9 | 1,706.3 |
| 2009 | 1,761.7 | 1,964.8 | 1,982.4 | 1,952.0 | 1,833.4 | 2,012.7 | 1,979.7 | 1,994.7 | 2,047.1 | 2,006.9 | 2,088.1 | 1,963.5 |
| 2010 | 2,017.6 | 2,116.1 | 2,328.1 | 2,207.5 | 2,199.8 | 2,332.6 | 1,792.7 | 2,053.1 | 2,124.0 | 1,878.5 | 1,898.8 | 1,891.1 |
| 2011 | 1,846.4 | 2,014.4 | 1,929.6 | 2,036.7 | 2,074.4 | 2,232.5 | 2,029.8 | 2,095.4 | 1,993.3 | 1,763.5 | 1,965.1 | 1,824.0 |
| 2012 | 1,770.9 | 1,724.6 | 1,689.0 | 1,704.7 | 1,850.4 | 1,412.8 | 1,471.7 | 2,242.9 | 2,282.6 | 2,443.2 | 2,379.6 | 2,335.6 |
| 2013 | 2,532.6 | 1,946.3 | 1,964.3 | 2,251.7 | 1,619.1 | 1,553.5 | 1,559.5 | 2,184.7 | 2,076.9 | 2,075.1 | 1,543.3 | 1,526.5 |
| 2014 | 1,763.3 | 1,898.4 | W | 2,210.1 | 2,173.5 | 2,368.0 | W | 2,247.5 | 2,501.2 | 2,573.8 | 2,676.0 | 2,531.5 |
| 2015 | 2,607.1 | 2,679.7 | 2,233.2 | 2,231.0 | W | W | W | W | 2,365.5 | W | W | W |
| 2016 | 2,542.6 | 2,530.0 | 2,534.9 | 2,460.7 | W | W | W | W | W | W | W | W |
| 2017 | W | W | W | W | W | W | W | W | W | W | W | W |
| 2018 | W | W | 2,597.1 | 2,760.2 | 2,567.5 | W | W | W | W | 2,840.3 | 3,118.3 | 2,835.8 |
| 2019 | 2,828.0 | 2,931.1 | 2,727.4 | 2,586.8 | 2,655.2 | 2,567.8 | 2,875.5 | 2,773.2 | 2,634.9 | 2,549.7 | 2,616.3 | 2,683.9 |
| 2020 | 2,419.3 | 2,436.1 | 2,519.9 | 2,413.4 | 2,030.0 | 1,978.4 | 1,724.5 | 1,751.3 | 1,826.1 | 1,702.9 | 1,732.0 | 1,747.3 |
| 2021 | 1,868.4 | 1,529.0 | 1,912.8 | 1,975.6 | 1,884.4 | 1,874.7 | 1,806.2 | 1,578.1 | 1,727.6 | 1,716.6 | 1,620.8 | 1,671.5 |
| 2022 | 1,806.1 | 1,724.8 | 1,712.9 | |||||||||
| - = No Data Reported; -- = Not Applicable; NA = Not Available; W = Withheld to avoid disclosure of individual company data. |
| Release Date: 6/1/2022 |
| Next Release Date: TBD |