|
Download Data (XLS File) |
|
||||||||
|
||||||||
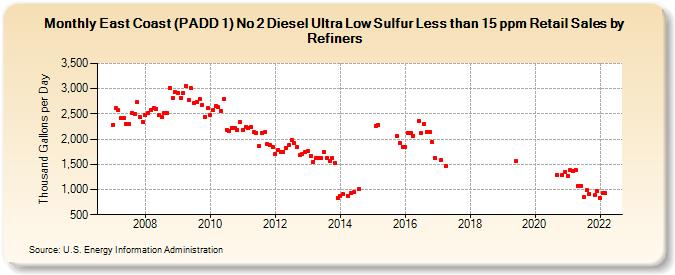
| East Coast (PADD 1) No 2 Diesel Ultra Low Sulfur Less than 15 ppm Retail Sales by Refiners (Thousand Gallons per Day) | ||||||||
| Year | Jan | Feb | Mar | Apr | May | Jun | Jul | Aug | Sep | Oct | Nov | Dec |
|---|---|---|---|---|---|---|---|---|---|---|---|---|
| 2007 | 2,286.9 | 2,619.5 | 2,571.4 | 2,423.2 | 2,413.9 | 2,308.8 | 2,298.2 | 2,523.6 | 2,495.4 | 2,727.1 | 2,444.1 | 2,337.9 |
| 2008 | 2,476.6 | 2,518.5 | 2,575.4 | 2,622.3 | 2,604.4 | 2,469.2 | 2,432.3 | 2,527.1 | 2,512.1 | 3,016.9 | 2,817.2 | 2,924.4 |
| 2009 | 2,920.5 | 2,822.3 | 2,917.1 | 3,055.9 | 2,781.0 | 3,008.6 | 2,719.5 | 2,726.9 | 2,795.3 | 2,677.8 | 2,442.9 | 2,615.9 |
| 2010 | 2,474.7 | 2,568.1 | 2,653.8 | 2,631.7 | 2,558.8 | 2,788.6 | 2,188.6 | 2,169.8 | 2,224.7 | 2,227.2 | 2,186.4 | 2,340.4 |
| 2011 | 2,172.8 | 2,244.6 | 2,220.7 | 2,245.8 | 2,143.2 | 2,130.3 | 1,867.8 | 2,118.8 | 2,134.6 | 1,905.6 | 1,876.9 | 1,838.1 |
| 2012 | 1,713.0 | 1,781.4 | 1,746.5 | 1,748.5 | 1,831.8 | 1,873.9 | 1,981.2 | 1,919.6 | 1,846.7 | 1,685.0 | 1,701.6 | 1,739.2 |
| 2013 | 1,766.1 | 1,670.6 | 1,551.0 | 1,619.7 | 1,627.6 | 1,617.6 | 1,753.5 | 1,632.1 | 1,570.9 | 1,621.0 | 1,525.2 | 835.4 |
| 2014 | 879.3 | 910.4 | W | 879.2 | 922.3 | 943.6 | W | 1,003.4 | W | W | W | W |
| 2015 | W | 2,251.0 | 2,282.8 | W | W | W | W | W | W | 2,069.2 | 1,928.2 | 1,851.5 |
| 2016 | 1,848.9 | 2,127.1 | 2,112.1 | 2,067.9 | W | 2,355.9 | 2,111.8 | 2,303.2 | 2,143.5 | 2,141.8 | 1,936.0 | 1,631.5 |
| 2017 | W | 1,579.1 | W | 1,460.5 | W | W | W | W | W | W | W | W |
| 2018 | W | W | W | W | W | W | W | W | W | W | W | W |
| 2019 | W | W | W | W | W | 1,569.9 | W | W | W | W | W | W |
| 2020 | W | W | W | W | W | W | W | W | 1,293.4 | W | 1,286.0 | 1,352.1 |
| 2021 | 1,262.7 | 1,383.1 | 1,376.9 | 1,387.6 | 1,077.9 | 1,078.8 | 846.0 | 980.8 | 913.5 | W | 889.7 | 964.0 |
| 2022 | 832.0 | 928.9 | 922.9 | |||||||||
| - = No Data Reported; -- = Not Applicable; NA = Not Available; W = Withheld to avoid disclosure of individual company data. |
| Release Date: 6/1/2022 |
| Next Release Date: TBD |