|
Download Data (XLS File) |
|
||||||||
|
||||||||
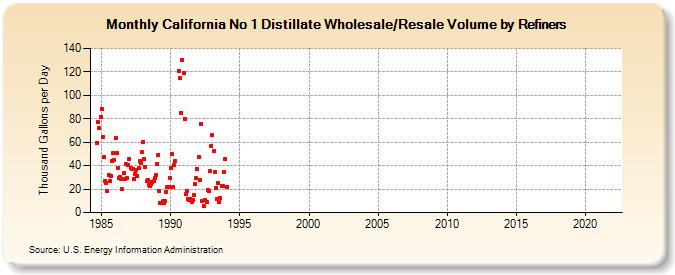
| California No 1 Distillate Wholesale/Resale Volume by Refiners (Thousand Gallons per Day) | ||||||||
| Year | Jan | Feb | Mar | Apr | May | Jun | Jul | Aug | Sep | Oct | Nov | Dec |
|---|---|---|---|---|---|---|---|---|---|---|---|---|
| 1984 | 59.6 | 77.1 | 71.7 | 81.5 | ||||||||
| 1985 | 88.2 | 64.8 | 47.5 | 26.9 | 25.2 | 18.2 | 32.3 | 26.5 | 31.3 | 44.0 | 51.1 | 44.5 |
| 1986 | 64.0 | 50.6 | 38.0 | 29.7 | 30.6 | 28.6 | 19.8 | 33.6 | 28.2 | 41.1 | 29.8 | 40.9 |
| 1987 | 45.8 | 38.1 | 37.2 | 37.4 | 28.8 | 32.9 | 36.5 | 31.5 | 37.7 | 44.1 | 42.3 | 51.5 |
| 1988 | 60.0 | 45.4 | 38.7 | 26.8 | 27.8 | 23.4 | 22.8 | 24.0 | 26.3 | 26.6 | 29.6 | 32.1 |
| 1989 | 41.7 | 49.5 | 18.6 | 8.5 | 8.3 | 9.6 | 7.9 | 10.2 | 17.5 | 21.6 | 21.6 | 29.8 |
| 1990 | 38.1 | 49.9 | 21.5 | 40.4 | 44.0 | W | W | 121.0 | 114.6 | 85.2 | 130.0 | 119.3 |
| 1991 | 80.0 | 15.8 | 18.6 | 11.9 | 10.4 | 11.6 | 8.9 | 10.8 | 14.7 | 24.1 | 29.1 | 37.2 |
| 1992 | 47.3 | 27.8 | 75.7 | 10.2 | W | 5.8 | 10.6 | 9.1 | 19.5 | 18.7 | 35.1 | 57.0 |
| 1993 | 65.8 | 52.3 | 34.2 | 21.3 | 11.5 | 25.6 | 9.2 | 12.6 | 22.6 | 22.5 | 34.4 | 45.5 |
| 1994 | W | 22.0 | W | W | W | W | W | W | W | W | W | W |
| 1995 | W | W | W | - | - | - | W | W | W | W | W | W |
| 1996 | W | W | W | - | W | W | W | W | W | W | W | W |
| 1997 | W | W | W | - | - | - | - | - | - | - | W | - |
| 1998 | W | W | W | - | - | - | - | - | - | - | W | W |
| 1999 | - | - | - | - | - | - | - | - | - | - | - | - |
| 2000 | - | - | - | - | - | - | - | - | - | - | - | - |
| 2001 | - | - | - | - | - | - | - | - | - | - | - | - |
| 2002 | - | - | - | - | - | - | - | - | - | - | - | W |
| 2003 | - | - | - | - | - | - | - | - | - | - | - | - |
| 2004 | - | - | - | - | - | W | W | W | W | W | W | W |
| 2005 | W | W | W | W | W | W | - | W | W | W | W | W |
| 2006 | W | W | W | W | W | - | - | - | - | - | - | - |
| 2007 | - | - | - | - | - | - | - | - | - | - | - | - |
| 2008 | - | - | - | - | - | - | - | - | - | - | - | W |
| 2009 | NA | - | - | - | - | - | - | - | - | - | - | - |
| 2010 | - | - | - | - | - | - | - | - | - | - | - | - |
| 2011 | - | - | - | - | W | - | - | - | - | - | - | - |
| 2012 | - | - | - | - | - | - | - | W | - | - | - | - |
| 2013 | - | - | - | - | - | - | - | - | - | - | W | - |
| 2014 | - | - | - | - | - | - | - | - | - | - | - | - |
| 2015 | - | - | - | - | - | - | - | - | - | - | - | - |
| 2016 | - | - | - | - | - | - | - | - | - | - | - | - |
| 2017 | - | - | - | - | - | - | - | - | - | - | - | - |
| 2018 | - | - | - | - | - | - | - | - | - | - | - | - |
| 2019 | - | - | - | - | - | - | - | - | - | - | - | - |
| 2020 | - | W | - | - | - | - | - | - | - | - | - | - |
| 2021 | - | - | - | - | - | - | - | - | - | - | - | - |
| 2022 | - | - | - | |||||||||
| - = No Data Reported; -- = Not Applicable; NA = Not Available; W = Withheld to avoid disclosure of individual company data. |
| Release Date: 6/1/2022 |
| Next Release Date: TBD |