|
Download Data (XLS File) |
|
||||||||
|
||||||||
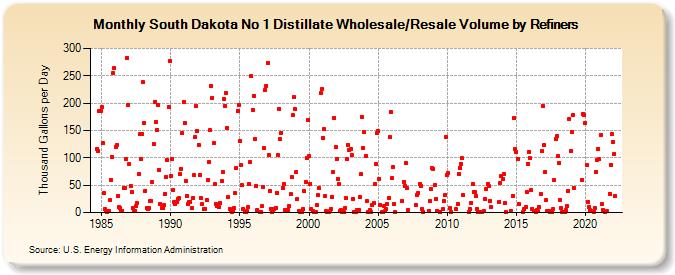
| South Dakota No 1 Distillate Wholesale/Resale Volume by Refiners (Thousand Gallons per Day) | ||||||||
| Year | Jan | Feb | Mar | Apr | May | Jun | Jul | Aug | Sep | Oct | Nov | Dec |
|---|---|---|---|---|---|---|---|---|---|---|---|---|
| 1984 | 115.8 | 112.9 | 186.0 | 185.2 | ||||||||
| 1985 | 192.3 | 126.4 | 36.1 | 5.6 | 2.8 | 1.9 | 3.2 | 22.7 | 60.1 | 101.6 | 255.4 | 263.6 |
| 1986 | 119.8 | 123.5 | 30.8 | 10.8 | 8.2 | 3.4 | 3.5 | 44.9 | 45.5 | 98.1 | 282.8 | 196.8 |
| 1987 | 88.5 | 49.4 | 38.0 | 8.9 | 2.8 | 3.7 | 12.0 | 16.9 | 69.7 | 144.0 | 97.0 | 144.4 |
| 1988 | 237.7 | 163.2 | 40.2 | 8.5 | 6.1 | 9.1 | 21.1 | 21.3 | 55.7 | 125.9 | 202.9 | 166.1 |
| 1989 | 151.7 | 196.4 | 78.2 | 15.8 | 8.5 | 8.0 | 13.6 | 34.4 | 65.7 | 95.4 | 192.8 | 277.4 |
| 1990 | 67.1 | 97.0 | 40.7 | 19.3 | 15.6 | 18.4 | 25.5 | 26.3 | 69.7 | 79.2 | 145.2 | 202.1 |
| 1991 | 163.6 | 57.5 | 30.9 | 15.1 | 18.4 | 19.5 | 7.8 | 26.4 | 67.9 | 137.8 | 194.1 | 148.2 |
| 1992 | 124.3 | 68.7 | 27.5 | 15.4 | W | 6.8 | 7.2 | 22.5 | 59.1 | 92.1 | 150.3 | 231.0 |
| 1993 | 209.5 | 126.3 | 52.1 | 15.4 | 11.9 | 13.1 | 10.1 | 16.6 | 57.4 | 73.5 | 207.6 | 195.1 |
| 1994 | 218.9 | 154.6 | 27.6 | 7.4 | 4.7 | 1.1 | 2.5 | 7.6 | 35.6 | 81.2 | 185.8 | 196.9 |
| 1995 | 131.3 | 86.1 | 49.6 | 7.2 | 1.9 | 1.9 | 3.5 | 9.3 | 52.0 | 92.0 | 249.3 | 187.5 |
| 1996 | 213.7 | 134.9 | 48.4 | 5.4 | W | 1.1 | 1.3 | 11.4 | 46.8 | 117.2 | 223.7 | 231.7 |
| 1997 | 274.0 | 105.3 | 39.1 | 7.3 | 0.5 | 2.9 | 5.9 | 8.9 | 36.6 | 104.8 | 189.9 | 133.8 |
| 1998 | 146.0 | 45.5 | 51.5 | 4.5 | 2.7 | 3.3 | 5.4 | 11.5 | 33.4 | 64.2 | 178.0 | 211.0 |
| 1999 | 188.7 | 73.7 | 24.5 | 2.8 | 0.8 | 1.6 | 1.4 | 5.7 | 38.6 | 56.2 | 99.5 | 169.9 |
| 2000 | 102.9 | 53.0 | 6.5 | 2.7 | 1.6 | 1.9 | 1.4 | 13.7 | 31.7 | 44.4 | 217.6 | 225.6 |
| 2001 | 137.0 | 152.0 | 31.0 | 2.8 | 1.9 | 1.2 | 2.6 | 6.6 | 29.0 | 73.5 | 173.4 | 119.3 |
| 2002 | 97.1 | 62.1 | 53.1 | 3.2 | 4.2 | 0.5 | 0.4 | 8.2 | 27.4 | 97.0 | 124.1 | 115.0 |
| 2003 | 115.4 | 105.2 | 25.2 | 1.9 | 0.4 | 0.4 | 4.0 | 5.4 | 28.5 | 69.6 | 174.8 | 118.5 |
| 2004 | 146.7 | 103.5 | 21.4 | 0.8 | 0.5 | 4.0 | 1.5 | 13.2 | 17.4 | 51.7 | 88.7 | 144.9 |
| 2005 | 149.1 | 62.1 | 14.1 | 0.4 | 0.6 | 11.4 | 3.2 | 7.1 | 16.1 | 27.0 | 137.9 | 184.5 |
| 2006 | 63.6 | 82.6 | 15.4 | 1.2 | W | W | - | W | W | 21.9 | 56.4 | 48.0 |
| 2007 | 90.8 | 44.4 | 4.8 | W | W | W | W | W | W | 13.4 | 31.5 | 35.8 |
| 2008 | 52.9 | 48.9 | 6.2 | 0.8 | W | W | W | W | 3.7 | 20.8 | 43.1 | 81.3 |
| 2009 | 80.3 | 49.5 | 24.5 | 3.5 | W | W | 0.5 | W | 5.6 | 21.4 | 32.3 | 138.9 |
| 2010 | 68.6 | 71.6 | 7.5 | 0.2 | W | W | W | W | 6.0 | 15.3 | 71.2 | 82.1 |
| 2011 | 89.3 | 99.0 | 31.6 | W | W | W | W | 0.8 | 5.6 | 17.5 | 52.1 | 37.5 |
| 2012 | 37.3 | 29.8 | 6.5 | 0.2 | 1.7 | 1.1 | 0.7 | W | 2.6 | 25.1 | 43.3 | 52.7 |
| 2013 | 47.7 | 21.9 | 10.5 | W | - | W | W | - | W | 20.0 | 53.3 | 66.3 |
| 2014 | 62.0 | 70.4 | 17.2 | 1.7 | W | W | W | 3.2 | W | 31.1 | 173.4 | 116.1 |
| 2015 | 109.8 | 98.7 | 15.3 | W | W | W | 1.0 | 6.5 | 10.0 | 37.5 | 89.0 | 111.5 |
| 2016 | 98.8 | 41.6 | 7.3 | 2.1 | W | 0.9 | 4.0 | 2.3 | 10.3 | 33.7 | 112.3 | 194.3 |
| 2017 | 122.7 | 73.3 | 22.1 | 3.4 | 2.0 | 1.7 | 3.1 | 1.9 | 6.8 | 59.0 | 134.2 | 139.0 |
| 2018 | 103.3 | 90.7 | 23.0 | 7.9 | 1.7 | W | 1.7 | 4.5 | 11.9 | 39.5 | 170.8 | 112.7 |
| 2019 | 147.7 | 178.4 | 45.0 | W | W | W | W | W | W | 60.1 | 181.0 | 177.7 |
| 2020 | 163.6 | 86.9 | 20.1 | 10.1 | 4.1 | 2.6 | W | 1.9 | 7.6 | 74.3 | 96.2 | 116.5 |
| 2021 | 97.0 | 141.8 | 15.6 | 5.0 | W | 1.0 | W | 2.2 | W | 34.5 | 87.6 | 143.0 |
| 2022 | 129.6 | 107.9 | 29.9 | |||||||||
| - = No Data Reported; -- = Not Applicable; NA = Not Available; W = Withheld to avoid disclosure of individual company data. |
| Release Date: 6/1/2022 |
| Next Release Date: TBD |