|
Download Data (XLS File) |
|
||||||||
|
||||||||
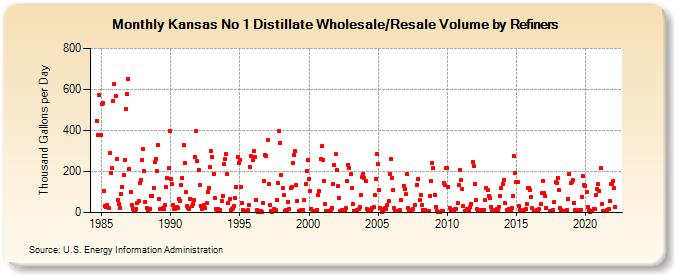
| Kansas No 1 Distillate Wholesale/Resale Volume by Refiners (Thousand Gallons per Day) | ||||||||
| Year | Jan | Feb | Mar | Apr | May | Jun | Jul | Aug | Sep | Oct | Nov | Dec |
|---|---|---|---|---|---|---|---|---|---|---|---|---|
| 1984 | 447.4 | 376.2 | 571.0 | 377.6 | ||||||||
| 1985 | 529.4 | 533.7 | 103.5 | 31.9 | 27.9 | 37.7 | 23.7 | 292.6 | 194.5 | 214.8 | 542.4 | 626.3 |
| 1986 | 567.1 | 259.3 | 61.8 | 39.7 | 19.9 | 89.0 | 124.7 | 184.7 | 254.5 | 503.4 | 577.1 | 651.4 |
| 1987 | 212.5 | 99.0 | 36.5 | 18.4 | 12.6 | 14.8 | 17.5 | 48.9 | 54.6 | 143.1 | 156.7 | 255.8 |
| 1988 | 308.7 | 201.1 | 53.0 | 22.3 | 12.5 | 18.0 | 19.3 | 79.9 | 82.5 | 120.1 | 247.1 | 262.2 |
| 1989 | 201.6 | 328.3 | 66.4 | 17.7 | 15.4 | 22.1 | 17.9 | 36.0 | 122.5 | 169.2 | 216.2 | 398.6 |
| 1990 | 163.7 | 136.8 | 34.5 | 18.8 | 16.9 | 26.6 | 20.6 | 65.3 | 58.4 | 133.8 | 170.8 | 330.5 |
| 1991 | 242.6 | 99.4 | 34.3 | 20.5 | 17.1 | 63.8 | 31.9 | 43.5 | 63.6 | 270.4 | 396.3 | 251.3 |
| 1992 | 208.9 | 133.9 | 34.4 | 16.5 | 33.0 | 35.5 | 23.6 | 44.5 | 98.2 | 120.7 | 221.5 | 297.7 |
| 1993 | 270.3 | 188.5 | 72.8 | 16.8 | 13.4 | 16.8 | 12.7 | 12.5 | 56.6 | 82.3 | 234.9 | 260.3 |
| 1994 | 285.2 | 186.1 | 48.4 | 63.9 | 10.7 | 16.7 | 23.1 | 29.9 | 70.8 | 124.0 | 272.4 | 243.8 |
| 1995 | 257.2 | 126.6 | 47.6 | 10.5 | 7.7 | 9.2 | 9.7 | 11.6 | 38.1 | 222.9 | 275.5 | 254.4 |
| 1996 | 299.5 | 268.5 | 61.5 | 11.2 | 3.4 | 6.8 | 7.4 | 4.6 | 46.4 | 152.4 | 281.0 | 276.5 |
| 1997 | 351.2 | 139.2 | 35.8 | 5.8 | 5.0 | 9.5 | 18.5 | 10.2 | 61.8 | 142.5 | 396.8 | 339.4 |
| 1998 | 180.7 | 117.3 | 85.2 | 9.1 | 10.5 | 14.8 | 50.8 | 15.7 | 120.5 | 125.0 | 240.8 | 282.1 |
| 1999 | 298.6 | 134.7 | 54.5 | 8.1 | 7.6 | 10.6 | 8.5 | 11.4 | 59.9 | 138.6 | 202.2 | 258.0 |
| 2000 | 165.5 | 105.4 | 17.5 | 7.7 | 7.4 | 7.9 | 7.1 | 11.6 | 87.3 | 104.8 | 260.8 | 322.8 |
| 2001 | 258.5 | 152.8 | 40.1 | 7.2 | 7.7 | 9.2 | 7.0 | 12.7 | 20.7 | 137.8 | 232.9 | 284.9 |
| 2002 | 208.0 | 129.6 | 70.5 | 6.2 | 7.0 | 10.4 | 12.1 | 11.2 | 20.9 | 152.6 | 234.1 | 217.5 |
| 2003 | 187.3 | 120.5 | 40.3 | 8.8 | 6.3 | 8.3 | 12.3 | 16.8 | 25.4 | 85.3 | 174.0 | 186.5 |
| 2004 | 167.9 | 153.2 | 18.5 | 7.4 | 7.2 | 10.1 | 12.5 | 22.4 | 28.3 | 83.4 | 165.3 | 285.3 |
| 2005 | 235.1 | 110.6 | 20.6 | 3.7 | 6.0 | 15.3 | 20.1 | 17.3 | 38.3 | 57.1 | 189.9 | 263.1 |
| 2006 | 169.5 | 110.9 | 22.0 | 5.9 | 6.7 | 6.5 | 7.7 | 12.1 | 60.8 | W | 130.8 | 115.2 |
| 2007 | 88.2 | 185.9 | 21.3 | 5.2 | 7.8 | 10.1 | 16.1 | W | 35.7 | W | 135.3 | 165.3 |
| 2008 | 60.2 | 85.0 | 39.2 | 10.2 | 7.5 | 12.3 | 8.8 | W | 9.8 | 82.5 | 155.3 | 241.4 |
| 2009 | 216.6 | 86.5 | 26.6 | 6.5 | 2.3 | 2.2 | 1.4 | 7.4 | 6.4 | 144.9 | 136.2 | 215.8 |
| 2010 | 214.8 | 126.8 | 23.8 | 9.3 | 8.5 | 12.8 | 14.2 | 17.9 | 17.7 | 48.0 | 134.3 | 208.5 |
| 2011 | 157.7 | 114.2 | 29.7 | 5.4 | W | 15.2 | 16.5 | 14.0 | 25.0 | 41.3 | 247.6 | 226.7 |
| 2012 | 139.9 | 59.8 | 15.7 | 6.5 | W | 11.6 | 12.5 | 9.8 | 12.7 | 59.8 | 121.3 | 108.2 |
| 2013 | 83.0 | 69.2 | 27.0 | 10.3 | W | 9.1 | 12.1 | 15.5 | 12.4 | 29.1 | 80.9 | 120.4 |
| 2014 | 137.8 | 159.7 | 46.7 | W | 14.7 | 12.1 | 15.8 | 12.0 | 24.2 | 79.7 | 273.2 | 193.8 |
| 2015 | 147.3 | 147.7 | 33.4 | 11.3 | 7.8 | 9.1 | 9.5 | 13.4 | 15.0 | 39.6 | 121.9 | 117.7 |
| 2016 | 112.1 | 75.6 | 20.3 | 7.0 | W | 8.4 | 11.6 | 13.0 | 15.8 | 40.4 | 95.6 | 154.8 |
| 2017 | 93.8 | 83.1 | 24.5 | W | W | 5.6 | W | W | 12.8 | 52.0 | 146.6 | 143.2 |
| 2018 | 170.6 | 107.8 | 24.3 | 10.1 | 6.9 | 8.7 | 9.1 | 9.8 | 14.5 | 64.9 | 190.2 | 142.4 |
| 2019 | 146.6 | 156.8 | 48.6 | 10.2 | 7.3 | 8.1 | 11.6 | 14.7 | 14.4 | 76.8 | 178.4 | 136.4 |
| 2020 | 131.1 | 99.3 | 24.9 | 11.8 | 3.6 | 8.3 | 6.9 | 18.5 | 15.2 | 84.0 | 116.3 | 137.9 |
| 2021 | 104.3 | 217.0 | 42.7 | 9.2 | 5.2 | 7.1 | 7.8 | 14.3 | 17.6 | 55.9 | 137.7 | 141.2 |
| 2022 | 153.5 | 118.3 | 29.4 | |||||||||
| - = No Data Reported; -- = Not Applicable; NA = Not Available; W = Withheld to avoid disclosure of individual company data. |
| Release Date: 6/1/2022 |
| Next Release Date: TBD |