|
Download Data (XLS File) |
|
||||||||
|
||||||||
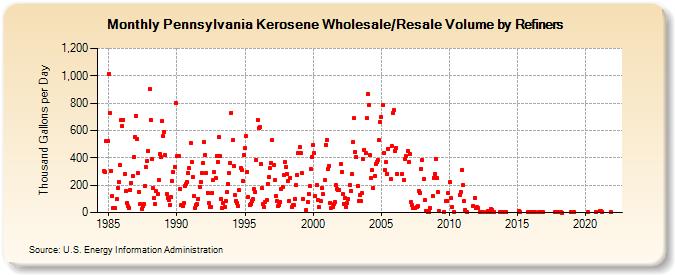
| Pennsylvania Kerosene Wholesale/Resale Volume by Refiners (Thousand Gallons per Day) | ||||||||
| Year | Jan | Feb | Mar | Apr | May | Jun | Jul | Aug | Sep | Oct | Nov | Dec |
|---|---|---|---|---|---|---|---|---|---|---|---|---|
| 1984 | 305.3 | 293.4 | 526.4 | 526.3 | ||||||||
| 1985 | 1,015.4 | 730.6 | 304.2 | 119.5 | 33.5 | 30.1 | 30.1 | 95.5 | 181.0 | 225.4 | 347.5 | 676.3 |
| 1986 | 633.1 | 680.1 | 281.5 | 156.5 | 69.6 | 49.7 | 36.0 | 167.5 | 218.4 | 267.7 | 407.1 | 553.5 |
| 1987 | 706.2 | 539.1 | 288.3 | 151.0 | 63.4 | 26.1 | 51.5 | 63.4 | 196.3 | 329.7 | 376.3 | 449.7 |
| 1988 | 904.1 | 680.0 | 389.4 | 180.5 | 105.0 | 61.0 | 155.5 | 133.6 | 236.8 | 427.7 | 402.7 | 669.5 |
| 1989 | 557.4 | 589.8 | 419.7 | 136.5 | 106.9 | 90.5 | 58.9 | 113.1 | 231.0 | 295.2 | 336.0 | 801.4 |
| 1990 | 410.3 | 412.5 | 411.5 | 174.1 | 52.4 | 45.1 | 67.5 | 194.8 | 207.1 | 225.4 | 292.7 | 325.2 |
| 1991 | 508.7 | 368.0 | 263.0 | 120.9 | 33.0 | 52.8 | 60.3 | 99.4 | 187.3 | 225.7 | 291.6 | 364.9 |
| 1992 | 519.3 | 424.3 | 288.0 | 145.4 | 66.5 | 39.8 | 43.5 | 143.2 | 234.4 | 293.5 | 250.2 | 416.7 |
| 1993 | 371.7 | 550.4 | 410.1 | 102.5 | 34.5 | 68.7 | 43.8 | 86.2 | 146.9 | 208.9 | 286.1 | 365.8 |
| 1994 | 730.6 | 528.1 | 340.2 | 126.2 | 88.0 | 69.2 | 45.4 | 161.6 | 326.2 | 309.6 | 227.8 | 420.8 |
| 1995 | 468.6 | 556.5 | 298.4 | 112.2 | 54.1 | 64.2 | 85.1 | 101.4 | 169.3 | 150.7 | 383.1 | 679.4 |
| 1996 | 614.5 | 623.6 | 353.9 | 176.1 | 64.6 | 39.0 | 77.3 | 89.3 | 211.5 | 259.6 | 324.0 | 362.5 |
| 1997 | 527.7 | 348.2 | 236.1 | 124.1 | 81.3 | 45.2 | 58.1 | 77.4 | 169.2 | 187.2 | 274.9 | 367.6 |
| 1998 | 335.5 | 282.0 | 233.3 | 84.5 | 254.6 | 38.5 | 52.2 | 52.7 | 100.6 | 199.2 | 274.2 | 433.5 |
| 1999 | 478.0 | 435.3 | 285.8 | 102.1 | W | W | 18.1 | 80.3 | 139.0 | 193.3 | 317.5 | 407.3 |
| 2000 | 493.1 | 433.7 | 120.8 | 200.6 | 93.2 | 40.4 | W | 81.4 | 179.3 | 133.6 | 235.9 | 496.3 |
| 2001 | 530.7 | 315.8 | 342.5 | 73.0 | 33.5 | 39.7 | 60.5 | 75.9 | 199.5 | 173.0 | 164.9 | 165.7 |
| 2002 | 356.1 | 299.9 | 135.4 | 65.7 | 104.7 | 42.4 | 67.6 | 98.1 | 199.3 | 159.7 | 280.8 | 515.7 |
| 2003 | 689.2 | 445.3 | 404.5 | 195.5 | 83.0 | 126.6 | 83.4 | 142.2 | 388.4 | 459.6 | 434.3 | 693.0 |
| 2004 | 865.4 | 787.5 | 417.3 | 252.9 | 308.3 | 179.3 | 265.4 | 355.4 | 368.2 | 382.6 | 529.1 | 659.8 |
| 2005 | 698.2 | 787.5 | 438.1 | 309.3 | 367.2 | 285.3 | 468.2 | W | 242.9 | 484.5 | 727.4 | 747.7 |
| 2006 | 453.5 | 475.3 | 283.1 | W | W | W | 283.9 | W | 239.3 | 393.5 | 410.5 | 447.1 |
| 2007 | 367.2 | 427.7 | 76.4 | 51.9 | 30.3 | 32.2 | 34.7 | 42.6 | 47.6 | 161.0 | 146.0 | 321.5 |
| 2008 | 385.0 | 241.7 | 88.6 | 13.8 | 11.3 | 7.3 | 6.9 | 32.1 | NA | 121.9 | 256.1 | 283.3 |
| 2009 | 391.9 | 249.8 | 147.0 | 10.8 | W | W | W | 1.4 | W | 84.9 | 84.9 | 144.4 |
| 2010 | 220.3 | 103.9 | 38.0 | W | 2.7 | W | W | W | W | 131.1 | 150.9 | 313.9 |
| 2011 | 200.8 | 84.0 | 21.9 | 5.6 | W | W | W | W | W | 47.5 | 108.9 | 33.1 |
| 2012 | 38.9 | 32.2 | W | 3.4 | 3.1 | 3.8 | W | W | W | 6.1 | 10.2 | 6.4 |
| 2013 | 25.2 | 21.5 | 3.9 | 1.0 | W | W | W | W | 1.0 | W | W | 3.0 |
| 2014 | W | NA | 2.4 | NA | W | - | W | W | W | W | W | W |
| 2015 | W | 12.3 | 3.2 | W | W | W | W | W | W | 2.5 | 2.2 | 2.6 |
| 2016 | 4.2 | 4.4 | W | 0.7 | W | W | W | 1.1 | W | 1.5 | 3.0 | W |
| 2017 | W | W | W | W | W | W | W | W | W | 1.6 | 7.0 | 4.5 |
| 2018 | W | W | 1.5 | 0.4 | W | W | W | - | W | W | W | 5.1 |
| 2019 | W | 2.2 | W | W | W | - | - | W | W | W | W | W |
| 2020 | W | W | 3.2 | W | W | W | - | W | W | 5.2 | W | W |
| 2021 | 11.0 | 11.0 | 2.4 | W | W | W | W | W | W | W | 4.7 | W |
| 2022 | W | W | W | |||||||||
| - = No Data Reported; -- = Not Applicable; NA = Not Available; W = Withheld to avoid disclosure of individual company data. |
| Release Date: 6/1/2022 |
| Next Release Date: TBD |