|
Download Data (XLS File) |
|
||||||||
|
||||||||
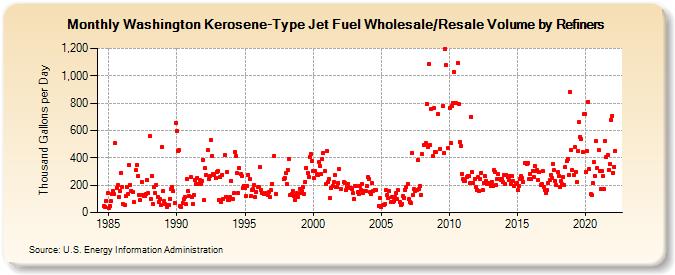
| Washington Kerosene-Type Jet Fuel Wholesale/Resale Volume by Refiners (Thousand Gallons per Day) | ||||||||
| Year | Jan | Feb | Mar | Apr | May | Jun | Jul | Aug | Sep | Oct | Nov | Dec |
|---|---|---|---|---|---|---|---|---|---|---|---|---|
| 1984 | 45.4 | 42.5 | 86.9 | 141.0 | ||||||||
| 1985 | 33.3 | 51.3 | 82.5 | 134.7 | 156.4 | 133.6 | 505.1 | 181.6 | 199.6 | 115.0 | 160.2 | 292.5 |
| 1986 | 185.4 | 59.2 | 53.1 | 118.1 | 187.2 | 132.4 | 346.5 | 205.0 | 160.8 | 152.8 | 73.9 | W |
| 1987 | 308.6 | 346.9 | 268.4 | 131.4 | 88.5 | 225.0 | 126.8 | 121.0 | 117.6 | 137.7 | 237.9 | 142.4 |
| 1988 | 558.7 | 102.6 | 268.9 | 65.4 | 188.4 | 143.4 | 203.7 | 116.9 | 76.9 | 98.8 | 56.9 | 480.5 |
| 1989 | 155.2 | 82.0 | 59.7 | 42.9 | 58.2 | 58.8 | 102.1 | 169.5 | 184.2 | 154.7 | 69.2 | 657.7 |
| 1990 | 596.5 | 446.4 | 456.9 | 47.8 | 44.2 | 70.7 | 97.2 | 113.9 | 60.8 | 245.1 | 154.3 | 117.8 |
| 1991 | 260.2 | 117.1 | 61.5 | 131.1 | 234.7 | 210.1 | 254.5 | 210.9 | 241.2 | 209.1 | 227.3 | 387.7 |
| 1992 | 89.3 | 322.8 | 274.0 | 454.1 | 243.8 | 266.1 | 530.9 | 415.8 | 280.4 | 277.1 | 251.2 | 297.5 |
| 1993 | 300.3 | 95.2 | 257.2 | 74.3 | 277.5 | 100.2 | 419.3 | 112.3 | 296.2 | 95.0 | 91.4 | 112.3 |
| 1994 | 231.2 | 98.0 | 139.6 | 439.1 | 416.4 | 285.7 | 144.3 | 326.9 | 278.4 | 270.2 | 179.7 | 197.1 |
| 1995 | 180.2 | 120.2 | 192.7 | 276.7 | 247.6 | 117.6 | 163.4 | 169.5 | 200.5 | 110.7 | 153.3 | 186.1 |
| 1996 | 186.4 | 331.6 | 165.3 | 146.3 | 144.3 | 133.9 | 138.0 | 146.5 | 130.6 | 147.0 | 110.2 | 161.9 |
| 1997 | 209.2 | 409.8 | W | 137.2 | W | W | W | W | W | W | 243.1 | 253.1 |
| 1998 | 289.1 | 207.4 | 312.4 | 390.9 | 125.5 | 136.6 | 158.7 | 121.4 | 94.9 | 130.6 | 140.7 | 115.3 |
| 1999 | 173.6 | 144.1 | 158.4 | 185.7 | 136.7 | 225.5 | 329.0 | 286.4 | 263.4 | 407.4 | 425.4 | 377.2 |
| 2000 | 306.3 | 249.5 | 302.0 | 282.0 | 271.1 | 366.3 | 341.3 | 278.8 | 389.3 | 433.9 | 303.9 | 205.4 |
| 2001 | 452.1 | 222.1 | 243.8 | 105.5 | 179.7 | 193.3 | 222.5 | 274.9 | 183.4 | 186.3 | 217.4 | 319.1 |
| 2002 | 175.5 | W | W | 222.2 | 214.1 | 165.6 | 185.4 | 211.1 | 180.5 | 181.3 | 171.4 | 139.4 |
| 2003 | 102.0 | 191.3 | 192.1 | 148.2 | 136.7 | 196.9 | 167.6 | 209.5 | 144.4 | 157.6 | 156.8 | 193.9 |
| 2004 | 257.0 | 244.0 | 149.3 | 133.3 | 213.3 | 156.9 | 166.0 | 165.8 | W | W | 50.3 | 106.1 |
| 2005 | 41.6 | 52.7 | 56.3 | 64.1 | 161.9 | 127.8 | 105.7 | 158.4 | 74.6 | 113.5 | 78.7 | 82.8 |
| 2006 | 113.8 | 141.6 | 96.8 | 161.7 | 78.2 | 57.7 | 66.0 | 117.7 | 109.7 | 162.2 | 188.8 | 207.1 |
| 2007 | 96.6 | 79.4 | 72.0 | 435.2 | 129.8 | 169.9 | 156.2 | 167.8 | 381.1 | 174.6 | 193.5 | 130.6 |
| 2008 | 427.6 | 492.0 | NA | 506.4 | 796.4 | 477.6 | 1,087.8 | 493.1 | 759.7 | 410.4 | 764.1 | 440.9 |
| 2009 | 440.3 | NA | 723.4 | W | 467.9 | NA | 776.2 | 433.9 | 1,193.9 | 1,076.1 | W | 468.7 |
| 2010 | 764.0 | 507.0 | 780.0 | 800.2 | 1,029.7 | 804.4 | 798.6 | 1,094.1 | 791.8 | 519.0 | 488.4 | 284.4 |
| 2011 | 242.0 | 227.8 | 228.7 | 260.1 | 267.1 | 263.7 | 213.0 | 700.5 | 294.9 | 216.0 | 248.9 | 187.4 |
| 2012 | 165.1 | 257.6 | 154.8 | 246.1 | 291.7 | 165.4 | 216.3 | 264.3 | 229.8 | 205.2 | 211.0 | 218.4 |
| 2013 | 191.5 | 224.6 | 196.1 | 309.3 | 296.4 | 201.1 | 243.6 | 279.7 | 246.1 | 239.9 | 247.8 | 220.5 |
| 2014 | 276.8 | 208.7 | 276.2 | 259.4 | 235.9 | 270.4 | 210.8 | 263.9 | 230.6 | 190.8 | 212.4 | 213.1 |
| 2015 | 161.8 | 196.3 | 244.1 | 266.9 | 249.6 | 224.8 | 365.4 | 361.2 | 352.3 | 360.6 | 243.2 | 278.9 |
| 2016 | 247.7 | 305.0 | 258.9 | 338.6 | 301.4 | 307.7 | 234.8 | 294.7 | 201.6 | 208.9 | 300.7 | 188.9 |
| 2017 | 161.7 | 141.9 | 164.0 | 216.2 | 235.0 | 273.8 | 251.7 | 357.8 | 309.2 | 233.3 | 198.9 | 294.3 |
| 2018 | 268.7 | 184.4 | 229.1 | 208.2 | 259.2 | 202.0 | 332.1 | 373.9 | 390.9 | 276.2 | 884.8 | 457.0 |
| 2019 | 310.2 | 271.4 | 480.1 | 299.1 | 222.8 | 451.7 | 658.7 | 555.6 | 535.6 | 439.3 | 718.7 | 721.6 |
| 2020 | 295.7 | 447.8 | 811.5 | 320.0 | 133.0 | 127.4 | 215.5 | 370.5 | 268.5 | 520.7 | 325.8 | 456.8 |
| 2021 | 306.2 | 170.4 | 306.2 | 263.6 | 170.4 | 524.5 | 403.4 | 423.2 | 311.9 | 356.3 | 679.3 | 708.5 |
| 2022 | 292.1 | 334.3 | 451.3 | |||||||||
| - = No Data Reported; -- = Not Applicable; NA = Not Available; W = Withheld to avoid disclosure of individual company data. |
| Release Date: 6/1/2022 |
| Next Release Date: TBD |