|
Download Data (XLS File) |
|
||||||||
|
||||||||
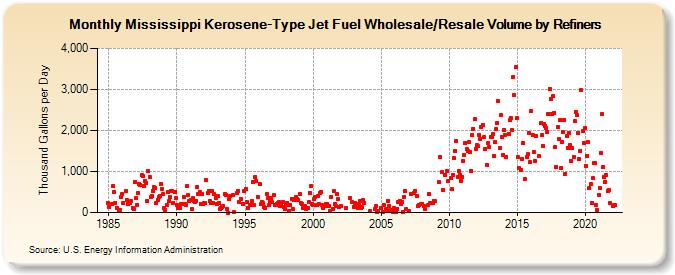
| Mississippi Kerosene-Type Jet Fuel Wholesale/Resale Volume by Refiners (Thousand Gallons per Day) | ||||||||
| Year | Jan | Feb | Mar | Apr | May | Jun | Jul | Aug | Sep | Oct | Nov | Dec |
|---|---|---|---|---|---|---|---|---|---|---|---|---|
| 1984 | W | W | W | 233.2 | ||||||||
| 1985 | 137.0 | W | W | 212.1 | 641.8 | 491.0 | 239.5 | 118.4 | W | 35.8 | 64.8 | 381.4 |
| 1986 | 462.0 | 227.5 | W | 527.3 | 307.6 | 214.7 | W | 240.9 | 282.9 | 105.3 | 76.5 | 750.4 |
| 1987 | 343.5 | 191.9 | 477.7 | 704.5 | 683.3 | 924.2 | 883.5 | 647.2 | 767.5 | 717.3 | 275.7 | 1,015.1 |
| 1988 | 874.2 | 373.6 | 410.9 | 526.7 | 613.5 | 600.1 | 242.6 | 311.1 | 390.3 | 411.4 | 706.0 | 579.7 |
| 1989 | 444.6 | 117.8 | 71.7 | 179.0 | 508.8 | 287.0 | 379.0 | 515.8 | 532.8 | 244.3 | 496.7 | 344.8 |
| 1990 | 194.5 | 119.1 | 144.3 | 112.5 | 208.4 | 219.1 | 379.2 | 211.6 | 181.7 | 638.7 | 419.4 | 274.7 |
| 1991 | 310.7 | 80.4 | 344.9 | 285.2 | 266.5 | 285.0 | 634.0 | 448.1 | 490.4 | 210.4 | 461.6 | 205.5 |
| 1992 | 241.8 | 225.6 | 786.6 | 476.4 | 526.6 | 292.8 | 221.8 | 521.6 | 223.0 | 449.5 | 355.1 | 210.2 |
| 1993 | 410.9 | 233.6 | 91.1 | 112.1 | 145.7 | 156.0 | 447.9 | 439.4 | 83.0 | 0.0 | 320.4 | 412.5 |
| 1994 | W | 421.5 | 11.6 | W | W | 470.6 | 522.7 | 249.3 | 329.2 | W | 219.8 | 518.5 |
| 1995 | W | 577.8 | 251.3 | 118.3 | 179.3 | 190.4 | 287.8 | 734.4 | 191.8 | 867.9 | 779.4 | 385.0 |
| 1996 | W | 689.1 | 219.5 | 259.8 | 220.8 | 132.3 | 117.6 | 447.4 | 354.7 | 188.5 | 291.2 | 347.4 |
| 1997 | 247.3 | 421.3 | 186.6 | 183.0 | 215.4 | 225.6 | 256.4 | 155.7 | 191.4 | 248.1 | 147.2 | 81.7 |
| 1998 | 176.5 | 231.4 | 182.0 | 44.0 | 183.5 | 337.1 | 97.8 | 294.8 | 332.1 | 384.4 | 340.9 | 304.2 |
| 1999 | 460.5 | 238.9 | 214.5 | 115.4 | 147.5 | 148.2 | 83.5 | 99.4 | 256.7 | 479.6 | 647.1 | 213.1 |
| 2000 | 179.5 | 332.6 | 385.9 | 183.9 | 396.2 | 197.2 | 483.0 | 501.3 | 183.9 | 117.7 | 153.3 | 218.0 |
| 2001 | 211.7 | 164.6 | 148.1 | 49.2 | 386.1 | 85.5 | 519.2 | 216.7 | 153.4 | 449.9 | 324.5 | 143.1 |
| 2002 | 163.1 | W | W | W | W | 110.1 | W | W | 354.2 | W | 249.1 | W |
| 2003 | 144.5 | 234.2 | 144.4 | 106.0 | 210.1 | 288.3 | 109.5 | 145.1 | 296.9 | 234.0 | W | W |
| 2004 | W | W | 41.2 | W | W | W | 86.8 | 148.8 | 14.9 | 41.9 | W | W |
| 2005 | 112.5 | 8.3 | 184.0 | W | 80.4 | 53.4 | 291.9 | 158.0 | 52.1 | NA | 10.7 | 113.5 |
| 2006 | 9.0 | 17.4 | 90.7 | 258.8 | 289.8 | 198.3 | 255.7 | 19.7 | 376.5 | 522.6 | 76.4 | W |
| 2007 | 46.6 | W | 445.4 | W | W | 477.1 | 534.7 | 415.3 | 156.2 | 182.5 | W | 211.4 |
| 2008 | 212.2 | 166.6 | 86.0 | W | W | 195.7 | 462.0 | 221.6 | W | 242.8 | 285.1 | 284.9 |
| 2009 | W | NA | W | 737.6 | 1,359.8 | 976.7 | 538.6 | W | 919.0 | W | 1,010.5 | 777.9 |
| 2010 | W | 839.0 | 578.0 | 923.0 | 1,324.6 | 1,501.6 | 1,741.5 | 875.4 | 1,011.2 | 923.4 | 774.7 | 872.4 |
| 2011 | 1,262.4 | 1,398.1 | 1,692.8 | 1,543.8 | 1,491.2 | 1,716.7 | 1,485.4 | 1,014.6 | 1,882.6 | 2,045.0 | 2,272.7 | 1,539.8 |
| 2012 | 1,634.1 | 1,613.4 | 1,900.0 | 1,797.0 | 2,076.2 | 2,142.7 | 1,832.3 | 1,548.2 | W | 1,154.8 | 1,702.5 | 1,598.2 |
| 2013 | 1,835.1 | 1,835.7 | 1,904.9 | 1,373.1 | 1,719.3 | 2,041.0 | 2,189.7 | 2,713.6 | 1,578.5 | 2,387.5 | 1,848.5 | 1,400.4 |
| 2014 | 2,017.1 | 1,890.0 | 1,353.9 | W | 1,920.5 | 2,255.1 | 2,297.4 | 2,005.9 | 3,312.5 | 2,860.9 | 3,534.8 | 2,302.1 |
| 2015 | 1,348.5 | 1,082.5 | W | 1,035.9 | 1,303.9 | 1,689.7 | 826.4 | W | 1,361.1 | 1,428.9 | 1,932.5 | 1,237.3 |
| 2016 | 2,473.0 | 1,894.3 | 1,486.5 | 1,260.5 | 1,854.3 | W | W | 1,367.4 | 2,175.0 | 1,900.3 | 1,633.7 | 2,153.9 |
| 2017 | 2,097.7 | 2,065.4 | 1,970.6 | 2,408.0 | 3,020.5 | 2,767.0 | 2,412.5 | 2,833.6 | 2,436.3 | 1,600.9 | 1,116.2 | 2,086.5 |
| 2018 | 1,792.5 | 2,254.6 | 1,088.0 | 1,727.9 | 1,970.7 | 2,261.7 | 948.9 | 1,856.4 | 1,569.6 | 1,946.0 | 1,644.5 | 1,260.7 |
| 2019 | 1,566.6 | 1,362.5 | 2,229.5 | 2,445.8 | 2,382.7 | 1,930.2 | 1,302.2 | 1,502.0 | 2,996.3 | 1,978.9 | 1,701.1 | 2,060.9 |
| 2020 | 1,139.2 | 1,388.1 | 1,718.5 | 604.1 | 686.3 | 229.8 | 843.2 | 1,210.5 | 1,209.8 | 190.0 | 61.8 | 433.9 |
| 2021 | 609.5 | 1,463.1 | 2,398.7 | 1,099.5 | 875.3 | 750.8 | 923.7 | 521.3 | 560.6 | 229.9 | W | W |
| 2022 | 161.9 | 190.5 | 174.9 | |||||||||
| - = No Data Reported; -- = Not Applicable; NA = Not Available; W = Withheld to avoid disclosure of individual company data. |
| Release Date: 6/1/2022 |
| Next Release Date: TBD |