|
Download Data (XLS File) |
|
||||||||
|
||||||||
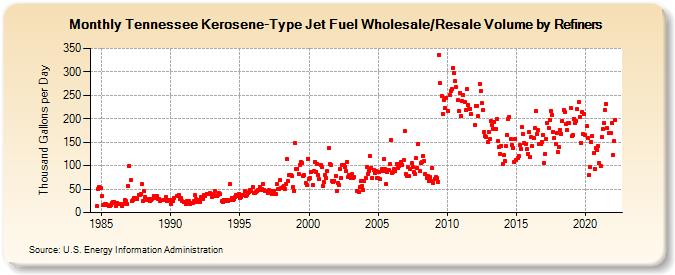
| Tennessee Kerosene-Type Jet Fuel Wholesale/Resale Volume by Refiners (Thousand Gallons per Day) | ||||||||
| Year | Jan | Feb | Mar | Apr | May | Jun | Jul | Aug | Sep | Oct | Nov | Dec |
|---|---|---|---|---|---|---|---|---|---|---|---|---|
| 1984 | 13.4 | 51.1 | 54.0 | 51.7 | ||||||||
| 1985 | 34.6 | 15.7 | 16.1 | 17.6 | 17.8 | 15.9 | 14.5 | 15.0 | 16.0 | 21.1 | 23.0 | 22.6 |
| 1986 | 15.0 | 21.4 | 18.6 | 17.8 | 18.0 | W | 15.0 | 19.1 | 27.3 | 24.0 | 18.3 | 57.1 |
| 1987 | 99.3 | 69.8 | 23.9 | 26.6 | 32.0 | 31.9 | 28.5 | 29.3 | 36.4 | 37.5 | 38.7 | 60.7 |
| 1988 | 24.9 | 45.4 | 33.4 | 27.7 | 29.5 | 28.5 | 25.0 | 26.3 | 29.6 | 35.1 | 35.9 | 31.9 |
| 1989 | 34.7 | 28.0 | 29.4 | 25.3 | W | 26.5 | 26.5 | 26.9 | 32.8 | 25.6 | 26.5 | 27.5 |
| 1990 | 18.2 | 25.8 | 24.7 | 31.1 | W | 34.4 | 36.2 | 38.3 | 28.0 | 30.6 | 23.7 | 22.4 |
| 1991 | 22.4 | 17.3 | 23.6 | 23.7 | 24.6 | 19.3 | 21.2 | 21.4 | 24.2 | 36.8 | 27.9 | 22.0 |
| 1992 | 26.2 | 22.7 | 32.6 | 30.9 | 29.6 | 38.5 | 36.2 | 40.5 | 40.5 | 38.7 | 40.8 | 39.6 |
| 1993 | 33.5 | 37.1 | 46.4 | 35.2 | 34.3 | 36.5 | 41.4 | 38.7 | 23.9 | 21.6 | 27.1 | 25.1 |
| 1994 | 25.3 | 27.2 | 25.1 | 60.7 | 25.8 | 31.5 | 26.6 | 28.3 | 34.1 | 37.1 | 35.6 | 40.2 |
| 1995 | 31.2 | 33.3 | 37.2 | 37.6 | 45.4 | 34.4 | 36.5 | 42.1 | 42.9 | 48.7 | 45.4 | 54.8 |
| 1996 | 41.8 | 42.0 | 44.8 | 45.5 | 47.8 | 54.5 | 48.5 | 51.0 | 61.7 | 49.0 | 45.5 | 46.1 |
| 1997 | 42.4 | 47.4 | 42.8 | 45.2 | 39.2 | 41.3 | 45.9 | 39.8 | 60.2 | 50.2 | 51.0 | 68.4 |
| 1998 | 51.5 | 54.0 | 57.4 | 50.2 | 60.0 | 114.0 | 66.6 | 79.3 | 80.5 | 79.0 | 54.9 | 46.6 |
| 1999 | 147.6 | 92.4 | 93.9 | 82.9 | 101.0 | 108.4 | 106.0 | 77.6 | 79.5 | 63.4 | 59.8 | 114.8 |
| 2000 | 72.5 | 74.2 | 86.7 | 58.3 | 88.5 | 108.4 | 86.7 | 104.5 | 80.6 | 71.5 | 101.1 | 97.6 |
| 2001 | 57.1 | 65.0 | 81.0 | 73.8 | 88.4 | 137.1 | 102.6 | 101.6 | 66.8 | 65.2 | 68.2 | 78.1 |
| 2002 | 46.1 | 63.0 | 58.6 | 93.2 | 74.1 | 100.6 | 101.8 | 97.9 | 88.1 | 108.4 | 76.1 | 79.7 |
| 2003 | 73.2 | 81.5 | 74.7 | 75.0 | W | W | 47.0 | 44.0 | 54.0 | 67.5 | 55.7 | 48.8 |
| 2004 | 66.4 | 72.7 | 97.3 | 83.1 | 89.3 | 120.9 | 95.0 | 74.5 | 90.0 | 84.6 | 88.8 | 73.7 |
| 2005 | 74.0 | 86.0 | 71.0 | 93.2 | 88.5 | 113.2 | 91.9 | 60.8 | 87.1 | 91.2 | 102.6 | 155.4 |
| 2006 | 84.0 | 86.7 | 92.9 | 88.0 | 103.5 | 95.2 | 100.2 | 103.5 | 107.6 | 102.0 | 111.2 | 173.8 |
| 2007 | 82.4 | 78.1 | 97.5 | 78.3 | 92.4 | 104.7 | 97.3 | 86.0 | 82.3 | 116.7 | 94.9 | 146.8 |
| 2008 | 88.5 | 106.0 | 107.3 | 120.8 | 110.2 | 82.4 | 74.6 | 78.6 | 68.3 | 76.3 | 67.0 | 95.3 |
| 2009 | 63.0 | 71.3 | 75.3 | 73.1 | 65.5 | 336.2 | 275.4 | 248.7 | 211.1 | 239.7 | 223.3 | 245.2 |
| 2010 | W | 215.9 | 250.3 | 258.9 | 262.7 | 308.2 | 296.8 | 280.4 | 267.8 | 239.8 | 215.6 | 255.4 |
| 2011 | 206.9 | 237.6 | 250.5 | 235.2 | 218.6 | 262.7 | 229.6 | 220.2 | 221.8 | 210.0 | W | W |
| 2012 | 186.6 | 227.7 | 227.0 | 205.3 | 273.6 | 259.6 | 233.0 | 219.5 | 171.8 | 162.8 | 161.1 | 149.8 |
| 2013 | 172.7 | 155.8 | 194.9 | 185.8 | 178.9 | 193.7 | 179.0 | 199.1 | 152.4 | 139.2 | 125.8 | 142.2 |
| 2014 | 103.9 | 122.1 | 108.9 | 141.8 | 165.2 | 198.6 | 203.8 | 156.5 | 144.8 | 137.9 | 107.6 | 157.6 |
| 2015 | 111.7 | 115.5 | 120.7 | 143.2 | 136.3 | 181.6 | 167.0 | 149.3 | 147.0 | 134.5 | 125.9 | 170.8 |
| 2016 | 118.2 | 160.6 | 142.5 | 159.4 | 179.8 | 215.6 | 168.2 | 175.6 | 146.0 | 146.4 | 151.2 | 166.4 |
| 2017 | 106.7 | 124.9 | 157.5 | 191.5 | 180.5 | 196.7 | 216.7 | 208.8 | 172.6 | 160.0 | 146.5 | 168.8 |
| 2018 | 128.9 | 139.7 | 176.8 | 168.2 | 195.7 | 218.5 | 214.3 | 188.7 | 176.3 | 192.0 | 190.3 | 223.7 |
| 2019 | 162.2 | 164.7 | 200.3 | 190.0 | 195.2 | 220.4 | 235.0 | 204.0 | 147.9 | 215.2 | 167.2 | 210.7 |
| 2020 | 165.1 | 184.0 | 158.3 | 79.3 | 97.2 | 150.7 | 163.0 | 126.9 | 93.6 | 136.8 | 133.4 | 141.5 |
| 2021 | 104.9 | 98.4 | 160.9 | 177.7 | 191.2 | 219.2 | 231.5 | 179.4 | 169.6 | 169.3 | 169.6 | 192.0 |
| 2022 | 123.7 | 151.6 | 198.0 | |||||||||
| - = No Data Reported; -- = Not Applicable; NA = Not Available; W = Withheld to avoid disclosure of individual company data. |
| Release Date: 6/1/2022 |
| Next Release Date: TBD |