|
Download Data (XLS File) |
|
||||||||
|
||||||||
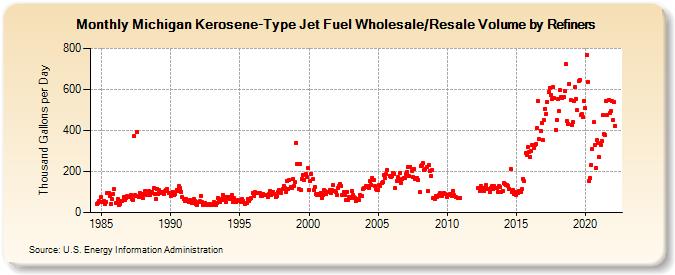
| Michigan Kerosene-Type Jet Fuel Wholesale/Resale Volume by Refiners (Thousand Gallons per Day) | ||||||||
| Year | Jan | Feb | Mar | Apr | May | Jun | Jul | Aug | Sep | Oct | Nov | Dec |
|---|---|---|---|---|---|---|---|---|---|---|---|---|
| 1984 | 43.8 | 46.9 | 55.6 | 75.2 | ||||||||
| 1985 | 52.5 | 53.3 | 55.2 | 42.4 | 52.9 | 96.0 | 97.5 | 80.6 | 42.8 | 64.5 | 91.9 | 112.8 |
| 1986 | 44.3 | 45.3 | 65.2 | 38.2 | 39.4 | 55.7 | 58.1 | 76.1 | 62.9 | 69.1 | 79.2 | 76.9 |
| 1987 | 74.7 | 83.6 | 65.2 | 63.1 | 372.9 | 84.0 | 83.1 | 391.4 | 75.3 | 97.0 | 91.0 | 83.0 |
| 1988 | 70.5 | 88.9 | 106.6 | 83.5 | 86.2 | 105.8 | 83.3 | 93.7 | 100.7 | 118.8 | 89.2 | 63.7 |
| 1989 | 114.6 | 92.4 | 108.7 | 97.7 | 101.6 | 101.5 | 90.8 | 102.8 | 107.7 | 114.0 | 93.8 | 95.7 |
| 1990 | 79.8 | 87.5 | 101.6 | 83.7 | 89.6 | 111.3 | 104.3 | 127.9 | 118.3 | 101.8 | 76.5 | 67.6 |
| 1991 | 56.7 | 65.7 | 56.5 | 58.6 | 51.6 | 61.0 | 48.0 | 50.5 | 64.4 | 55.3 | 40.7 | 38.2 |
| 1992 | 49.7 | 54.6 | 82.7 | 50.4 | 36.0 | 42.5 | 46.9 | 37.4 | 36.9 | 42.7 | 44.0 | 39.2 |
| 1993 | 36.8 | 49.4 | 46.2 | 38.8 | 48.0 | 72.1 | 56.8 | 51.4 | 66.4 | 87.2 | 62.3 | 76.1 |
| 1994 | 50.4 | 69.9 | 76.1 | 68.0 | 73.6 | 86.7 | 50.0 | 69.7 | 51.4 | 49.5 | 61.6 | 57.9 |
| 1995 | 58.2 | 51.6 | 66.5 | 58.5 | 43.0 | 44.3 | 44.7 | 67.8 | 56.8 | 65.7 | 70.4 | 97.2 |
| 1996 | 83.0 | 99.3 | 93.5 | 96.7 | 94.3 | 94.4 | 83.1 | 81.9 | 92.7 | 83.2 | 85.6 | 87.0 |
| 1997 | 74.4 | 92.1 | 105.8 | 84.4 | 100.3 | 100.6 | 91.2 | 75.3 | 83.1 | 101.9 | 110.2 | 98.0 |
| 1998 | 96.1 | 113.5 | 131.8 | 119.7 | 98.5 | 154.5 | 113.7 | 156.7 | 126.8 | 120.0 | 162.7 | 131.5 |
| 1999 | 147.4 | 339.5 | 237.7 | 116.8 | 238.0 | 107.8 | 163.8 | 184.8 | 157.9 | 185.7 | 170.9 | 216.1 |
| 2000 | 110.2 | 152.6 | 188.1 | 162.1 | 108.6 | 125.0 | 88.2 | 84.1 | 91.0 | 86.6 | 97.7 | 71.9 |
| 2001 | 86.7 | 111.5 | 103.0 | 89.1 | 102.5 | 98.8 | 110.2 | 97.1 | 109.9 | 134.2 | 105.0 | 100.9 |
| 2002 | 84.8 | 120.2 | 131.4 | 140.0 | 129.8 | 87.3 | 101.9 | 83.3 | 59.0 | 102.2 | 60.9 | 74.6 |
| 2003 | 71.6 | 105.4 | 86.0 | 74.6 | 72.2 | 56.6 | 67.0 | 61.9 | 84.6 | 82.6 | 81.5 | 116.5 |
| 2004 | 118.0 | 127.9 | 126.8 | 131.0 | 121.6 | 155.3 | 135.4 | 169.0 | 159.6 | 127.5 | 114.5 | 112.2 |
| 2005 | 111.6 | 135.4 | 130.6 | 145.1 | 149.7 | 182.2 | 167.2 | 187.3 | 207.7 | NA | 177.0 | 173.5 |
| 2006 | 176.5 | 192.6 | 190.3 | 120.0 | 152.6 | 171.1 | 161.1 | 194.3 | 143.8 | 163.1 | 170.8 | 168.4 |
| 2007 | 186.6 | 197.9 | 221.5 | 176.8 | 224.0 | 202.6 | 172.3 | 212.3 | 164.3 | 167.5 | 166.6 | 161.0 |
| 2008 | 98.2 | 225.6 | 230.2 | 241.0 | 207.1 | 214.1 | 221.7 | 104.5 | 230.5 | 204.5 | 180.2 | 206.7 |
| 2009 | 71.7 | 66.8 | 79.5 | 74.8 | 82.5 | 87.5 | 94.5 | 82.5 | 90.1 | 96.3 | 88.4 | W |
| 2010 | 74.0 | 86.3 | 89.8 | W | 82.0 | 106.4 | 85.0 | W | 73.6 | 69.5 | W | 73.3 |
| 2011 | W | W | W | W | W | W | W | W | W | W | W | W |
| 2012 | W | W | W | 121.5 | 107.1 | 128.7 | 122.0 | 120.0 | 107.3 | 114.8 | 134.4 | 112.9 |
| 2013 | 115.0 | 98.2 | 120.4 | 128.1 | 116.6 | 128.4 | 118.0 | 121.1 | 99.3 | 127.6 | 126.0 | 101.2 |
| 2014 | 107.0 | 142.5 | 138.4 | 132.9 | 133.5 | 130.0 | 113.2 | 212.0 | 100.5 | 111.1 | 90.4 | 102.5 |
| 2015 | 86.6 | 97.7 | 102.9 | 98.4 | 99.8 | 113.8 | 162.4 | 152.3 | 288.4 | 278.7 | 317.9 | 294.5 |
| 2016 | 270.9 | 299.6 | 328.4 | 316.1 | 329.6 | 333.2 | 411.6 | 542.5 | 356.1 | 399.7 | 438.5 | 351.8 |
| 2017 | 450.2 | 506.7 | 481.1 | 538.1 | 585.1 | 607.2 | 571.5 | 554.4 | 610.3 | 556.5 | 403.1 | 452.5 |
| 2018 | 554.3 | 492.8 | 596.0 | 562.9 | 556.5 | 563.3 | 594.5 | 722.1 | 444.7 | 432.0 | 628.3 | 546.1 |
| 2019 | 429.0 | 442.1 | 541.6 | 611.2 | 554.1 | 499.1 | 639.0 | 647.6 | 477.2 | 480.1 | 463.5 | 542.5 |
| 2020 | 507.3 | 768.9 | 638.4 | 152.9 | 167.5 | 232.6 | 310.5 | 439.3 | 330.1 | 219.2 | 352.3 | 337.4 |
| 2021 | 268.6 | 328.5 | 348.3 | 473.4 | 380.9 | 379.3 | 541.6 | 476.7 | 548.7 | 485.1 | 492.8 | 541.4 |
| 2022 | 449.3 | 538.9 | 424.1 | |||||||||
| - = No Data Reported; -- = Not Applicable; NA = Not Available; W = Withheld to avoid disclosure of individual company data. |
| Release Date: 6/1/2022 |
| Next Release Date: TBD |