|
Download Data (XLS File) |
|
||||||||
|
||||||||
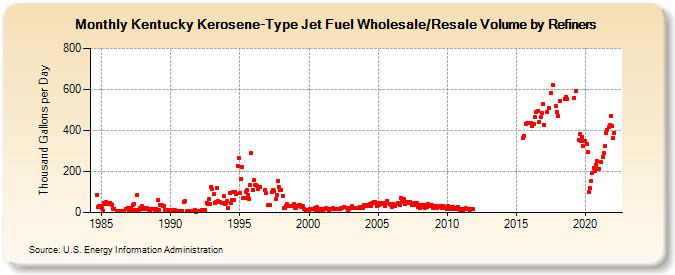
| Kentucky Kerosene-Type Jet Fuel Wholesale/Resale Volume by Refiners (Thousand Gallons per Day) | ||||||||
| Year | Jan | Feb | Mar | Apr | May | Jun | Jul | Aug | Sep | Oct | Nov | Dec |
|---|---|---|---|---|---|---|---|---|---|---|---|---|
| 1984 | 86.9 | 26.1 | 29.8 | 30.5 | ||||||||
| 1985 | 20.2 | 10.0 | 47.3 | 43.1 | 50.7 | 42.5 | 43.5 | 46.5 | 42.6 | 38.5 | 17.5 | 16.7 |
| 1986 | W | 5.7 | 7.3 | 6.1 | W | 5.8 | W | 9.9 | W | 17.6 | 18.4 | 21.6 |
| 1987 | 13.4 | 21.5 | 6.8 | 35.9 | 44.1 | 10.8 | 14.3 | 87.6 | 14.4 | 21.4 | 18.0 | 30.0 |
| 1988 | 17.9 | 17.7 | 22.2 | 23.5 | 15.8 | 13.7 | 11.3 | 15.1 | 15.9 | 17.5 | 14.0 | 17.5 |
| 1989 | 9.6 | 63.3 | 10.7 | 34.8 | 36.3 | 32.5 | 31.5 | 10.9 | 13.8 | 10.8 | 10.4 | 13.7 |
| 1990 | 5.5 | 7.9 | 6.2 | 12.1 | 12.1 | 7.7 | 6.0 | 9.1 | 7.8 | 8.1 | 6.8 | 49.1 |
| 1991 | 55.7 | W | 5.6 | 9.3 | 9.7 | 7.7 | 7.2 | 8.2 | 8.6 | 11.7 | 5.1 | 8.9 |
| 1992 | 7.4 | 6.4 | 7.2 | 12.6 | 13.9 | 9.5 | 12.1 | 45.5 | 41.2 | 63.8 | 43.6 | 124.2 |
| 1993 | 115.7 | 90.9 | 48.3 | 53.0 | 118.8 | 55.9 | 52.3 | 49.3 | 46.8 | 48.7 | 82.5 | 42.6 |
| 1994 | 45.1 | 55.4 | 20.6 | 96.7 | 45.8 | 63.6 | 99.4 | 60.0 | 101.7 | 90.8 | 227.5 | 265.9 |
| 1995 | 97.7 | 161.4 | 221.8 | 68.8 | 72.8 | 102.1 | 108.5 | 85.0 | 64.9 | 136.2 | 289.8 | 111.9 |
| 1996 | 161.0 | 136.2 | 133.8 | 129.2 | 116.4 | 123.1 | W | W | W | W | 109.9 | 94.6 |
| 1997 | 36.6 | W | 35.2 | W | 98.1 | 111.5 | 105.0 | 67.0 | 87.6 | 153.5 | 122.2 | 109.1 |
| 1998 | 111.7 | 82.1 | 20.8 | 21.8 | 33.9 | 39.9 | 30.6 | 30.0 | 32.5 | 29.6 | 29.8 | 44.1 |
| 1999 | 24.2 | 22.3 | 34.1 | 37.3 | 36.3 | 28.9 | 33.4 | 32.1 | 18.2 | 11.5 | 13.2 | 7.3 |
| 2000 | 11.1 | 15.7 | W | 15.3 | W | 21.2 | 14.2 | 25.7 | 13.7 | 17.4 | 13.0 | 15.4 |
| 2001 | 13.7 | 17.3 | 16.4 | 20.5 | 19.3 | 13.3 | 18.7 | 16.1 | 15.5 | 20.5 | 16.5 | 18.8 |
| 2002 | 18.4 | 16.3 | 16.2 | 15.1 | 20.2 | 24.3 | 25.1 | W | W | 20.6 | 13.9 | 16.7 |
| 2003 | 24.2 | 29.6 | 23.9 | 24.1 | 23.8 | 23.3 | 23.7 | 23.6 | 25.2 | 28.4 | 20.9 | 24.3 |
| 2004 | 34.6 | 31.3 | 34.6 | 31.5 | 35.6 | 42.0 | 34.4 | 46.0 | 51.2 | 50.4 | 46.0 | 31.7 |
| 2005 | 43.6 | 37.4 | 47.0 | 46.7 | 40.7 | 40.6 | 33.4 | 44.9 | 58.7 | NA | 42.3 | 38.2 |
| 2006 | 28.7 | 39.5 | 39.1 | 29.7 | 40.0 | 44.5 | 40.3 | 34.9 | 71.2 | 52.5 | 67.1 | 40.6 |
| 2007 | 49.3 | 48.1 | 47.1 | 51.8 | 50.6 | 37.5 | 37.1 | 49.0 | 42.5 | 35.8 | 44.5 | 26.2 |
| 2008 | 21.5 | 35.8 | 28.6 | 29.6 | 36.8 | 20.6 | 27.9 | 40.1 | 30.6 | 29.6 | 32.3 | 35.4 |
| 2009 | 23.1 | 19.9 | 29.9 | 21.5 | 29.2 | 26.8 | 30.7 | 20.2 | 30.6 | 29.5 | 20.8 | 21.9 |
| 2010 | 17.7 | 30.5 | 17.3 | 29.0 | 24.5 | 29.2 | 17.5 | 19.5 | 24.6 | 27.2 | 16.8 | 14.0 |
| 2011 | 13.9 | 16.9 | 14.5 | 19.3 | 20.0 | 19.6 | 18.3 | 19.1 | 14.7 | 18.3 | 18.4 | W |
| 2012 | W | W | W | W | W | W | W | W | W | W | W | W |
| 2013 | W | W | W | W | W | W | W | W | W | W | W | W |
| 2014 | W | W | W | W | W | W | W | W | W | W | W | W |
| 2015 | W | W | W | W | W | W | 363.3 | 374.5 | 432.6 | 435.1 | W | W |
| 2016 | W | 434.0 | 419.9 | 431.2 | 466.5 | 491.9 | W | 496.7 | 439.7 | 463.3 | 487.1 | 527.0 |
| 2017 | 424.3 | W | W | 491.8 | 507.3 | W | 585.0 | W | 621.1 | W | 519.7 | 491.0 |
| 2018 | 470.5 | W | 543.7 | W | W | W | 554.4 | 564.7 | 555.7 | W | W | W |
| 2019 | W | W | 559.7 | W | 593.5 | W | 356.0 | 382.4 | 349.0 | 367.0 | 325.3 | 350.0 |
| 2020 | 348.3 | 332.0 | 296.0 | 99.5 | 121.2 | 154.1 | 193.0 | 218.6 | 200.1 | 233.4 | 251.0 | 212.6 |
| 2021 | 214.1 | 244.4 | W | 271.7 | 291.3 | 322.1 | 389.9 | 403.6 | 415.2 | 424.5 | 471.9 | 424.2 |
| 2022 | 361.0 | 388.1 | W | |||||||||
| - = No Data Reported; -- = Not Applicable; NA = Not Available; W = Withheld to avoid disclosure of individual company data. |
| Release Date: 6/1/2022 |
| Next Release Date: TBD |