|
Download Data (XLS File) |
|
||||||||
|
||||||||
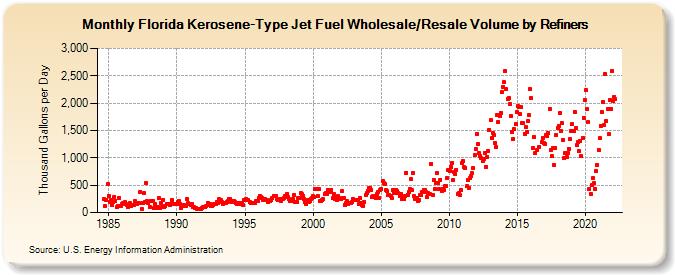
| Florida Kerosene-Type Jet Fuel Wholesale/Resale Volume by Refiners (Thousand Gallons per Day) | ||||||||
| Year | Jan | Feb | Mar | Apr | May | Jun | Jul | Aug | Sep | Oct | Nov | Dec |
|---|---|---|---|---|---|---|---|---|---|---|---|---|
| 1984 | 241.4 | 122.4 | 234.3 | 522.6 | ||||||||
| 1985 | 301.5 | 193.9 | 231.3 | 133.1 | 185.4 | 292.7 | 219.9 | 93.8 | 119.9 | 272.5 | 119.2 | 116.2 |
| 1986 | 150.8 | 173.4 | 184.7 | 158.8 | 140.5 | 105.0 | 133.3 | 165.9 | 116.2 | 133.2 | 136.2 | 209.9 |
| 1987 | 167.7 | 154.4 | 178.0 | 172.1 | 378.4 | 66.7 | 174.5 | 357.8 | 199.4 | 539.3 | 204.1 | 167.7 |
| 1988 | 108.9 | 218.8 | 215.0 | 218.7 | 90.2 | 149.2 | 77.3 | 99.3 | 262.1 | 87.0 | 178.0 | 102.2 |
| 1989 | 235.3 | 110.0 | 119.1 | 156.7 | 151.1 | 161.5 | 137.9 | 151.7 | 227.5 | 153.2 | 161.5 | 155.2 |
| 1990 | 157.7 | 195.7 | 202.3 | 165.2 | 79.2 | 120.9 | 145.3 | 122.0 | 113.7 | 240.0 | 168.6 | 153.3 |
| 1991 | 140.5 | 157.1 | 97.2 | 104.9 | 82.5 | 78.0 | 65.0 | 74.1 | 64.7 | 64.4 | 81.9 | 95.8 |
| 1992 | 98.9 | 109.4 | 127.6 | 177.9 | 146.9 | 156.9 | 123.2 | 119.9 | 135.1 | 160.2 | 150.1 | 195.3 |
| 1993 | 180.0 | 240.8 | 220.4 | 224.3 | 185.3 | 163.0 | 174.3 | 182.1 | 194.6 | 211.0 | 254.9 | 245.6 |
| 1994 | 201.9 | 209.7 | 214.5 | 188.5 | 172.1 | 159.8 | 150.6 | 171.3 | 156.8 | 176.9 | 131.2 | 225.5 |
| 1995 | 232.9 | 246.4 | 231.0 | 228.9 | 187.1 | 173.6 | 178.9 | 168.5 | 175.1 | 177.6 | 209.2 | 212.8 |
| 1996 | 269.0 | 304.7 | 285.6 | 273.7 | 227.9 | 233.7 | 239.7 | 231.2 | 187.2 | 211.0 | 219.3 | 226.8 |
| 1997 | 260.5 | 303.5 | 299.0 | 294.6 | 255.9 | 234.2 | 229.6 | 240.4 | 214.9 | 250.7 | 264.9 | 299.5 |
| 1998 | 276.9 | 344.9 | 275.8 | 240.9 | 212.5 | 209.3 | 244.9 | 317.1 | 183.9 | 200.6 | 200.8 | 267.8 |
| 1999 | 265.9 | 350.6 | 334.5 | 308.2 | 244.8 | 185.7 | 151.4 | 228.7 | 187.5 | 204.4 | 248.0 | 272.2 |
| 2000 | 298.8 | 282.1 | 425.0 | 437.2 | 297.9 | 433.7 | 207.8 | 214.2 | 233.8 | 242.5 | 331.0 | 356.4 |
| 2001 | 331.3 | 413.8 | 376.4 | 379.7 | 418.0 | 260.4 | 344.6 | 241.0 | 290.2 | 233.0 | 293.6 | 267.6 |
| 2002 | 255.2 | 386.5 | 266.5 | 262.9 | 134.4 | 171.3 | 206.6 | 164.5 | 166.8 | 183.7 | 195.5 | 244.4 |
| 2003 | 236.9 | 233.2 | 235.1 | 226.7 | 148.2 | 268.3 | 179.6 | 129.4 | 127.8 | 199.0 | 318.8 | 357.4 |
| 2004 | 397.8 | 449.2 | 454.7 | 421.3 | 293.3 | 303.2 | 283.5 | 266.9 | 339.2 | 380.3 | 266.4 | 418.6 |
| 2005 | 426.0 | 572.0 | 532.6 | 520.5 | 410.3 | 387.8 | 311.8 | 312.7 | 296.9 | 261.8 | 410.2 | 357.9 |
| 2006 | 349.6 | 409.8 | 386.3 | 354.4 | 299.9 | 343.7 | 240.9 | 265.5 | 247.6 | 302.9 | 727.9 | 325.5 |
| 2007 | 372.6 | 431.6 | 607.5 | 407.5 | 731.7 | 297.3 | 253.5 | 263.3 | 219.5 | 233.0 | 314.7 | 316.0 |
| 2008 | 380.3 | 409.2 | 418.8 | 374.6 | 281.7 | 361.3 | 335.8 | 333.8 | 893.1 | 322.7 | 598.4 | 426.1 |
| 2009 | 539.5 | 725.3 | 532.1 | 430.5 | 599.9 | 391.1 | 435.0 | 415.1 | 479.1 | 486.0 | 634.0 | 771.1 |
| 2010 | 756.2 | 831.0 | 905.4 | 602.2 | 739.9 | 705.8 | 780.8 | 337.2 | 351.0 | 317.5 | 405.4 | 905.9 |
| 2011 | 934.2 | 828.8 | 820.9 | 479.2 | 594.1 | 451.8 | 623.6 | 669.9 | 714.1 | 814.1 | 1,051.7 | 1,166.5 |
| 2012 | 1,440.6 | 1,254.1 | 1,080.2 | 1,037.8 | 992.7 | 935.1 | 983.1 | 1,097.1 | 840.7 | 1,022.5 | 1,125.8 | 1,516.6 |
| 2013 | 1,684.4 | 1,360.9 | 1,457.8 | 1,420.2 | 1,275.2 | 1,201.9 | 1,791.5 | 1,655.8 | 1,766.4 | 1,827.3 | 2,194.4 | 2,295.6 |
| 2014 | 2,378.1 | 2,586.6 | 2,248.9 | 2,071.9 | 2,096.8 | 1,976.8 | 1,762.4 | 1,478.9 | 1,345.6 | 1,518.2 | 1,615.0 | 1,841.7 |
| 2015 | 1,938.7 | 1,929.6 | 1,797.7 | 1,920.5 | 1,643.3 | 1,632.5 | 1,442.2 | 1,559.4 | 1,479.6 | 1,666.6 | 1,774.2 | 2,251.5 |
| 2016 | 2,088.3 | 1,181.3 | 1,388.9 | 1,080.3 | NA | 1,135.6 | NA | 1,194.0 | NA | 1,283.9 | 1,367.3 | 1,266.1 |
| 2017 | 1,258.9 | 1,412.8 | 1,396.3 | 1,447.0 | 1,894.9 | 1,144.7 | 1,026.4 | 1,175.5 | 869.2 | 1,181.3 | 1,422.7 | 1,552.6 |
| 2018 | 1,573.5 | 1,822.8 | 1,493.8 | 1,627.9 | 1,333.5 | 989.1 | 1,096.9 | 1,020.0 | 1,092.1 | 1,168.5 | 1,338.0 | 1,491.2 |
| 2019 | 1,612.1 | 1,489.5 | 1,843.5 | 1,543.6 | 1,228.4 | 1,292.7 | 1,128.3 | 1,308.7 | 1,026.4 | 1,369.2 | 1,734.1 | 2,065.3 |
| 2020 | 2,232.4 | 1,883.7 | 1,647.9 | 437.0 | 342.4 | 500.3 | 629.2 | 533.8 | 436.4 | 755.2 | 875.2 | 1,139.5 |
| 2021 | 1,360.4 | 1,588.0 | 1,838.7 | 2,015.3 | 1,602.6 | 2,529.5 | 1,672.5 | 1,896.2 | 1,433.1 | 2,056.8 | 1,899.6 | 2,585.3 |
| 2022 | 2,035.1 | 2,117.4 | 2,066.8 | |||||||||
| - = No Data Reported; -- = Not Applicable; NA = Not Available; W = Withheld to avoid disclosure of individual company data. |
| Release Date: 6/1/2022 |
| Next Release Date: TBD |