|
Download Data (XLS File) |
|
||||||||
|
||||||||
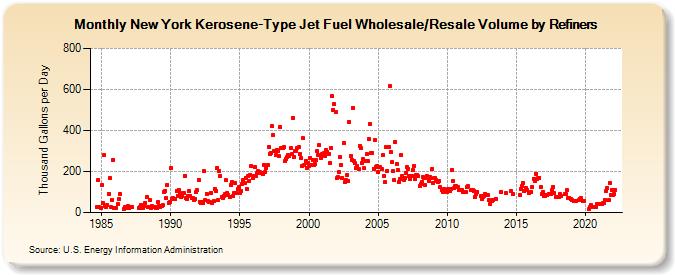
| New York Kerosene-Type Jet Fuel Wholesale/Resale Volume by Refiners (Thousand Gallons per Day) | ||||||||
| Year | Jan | Feb | Mar | Apr | May | Jun | Jul | Aug | Sep | Oct | Nov | Dec |
|---|---|---|---|---|---|---|---|---|---|---|---|---|
| 1984 | 27.7 | 161.0 | 25.2 | 24.4 | ||||||||
| 1985 | 134.7 | 44.7 | 281.3 | 30.0 | 26.9 | 36.1 | 92.5 | 167.3 | 25.5 | 62.3 | 257.9 | 23.1 |
| 1986 | 22.9 | W | 39.7 | 66.1 | 91.2 | NA | W | 18.5 | 26.8 | 26.1 | 21.1 | 29.9 |
| 1987 | 21.9 | 25.3 | 25.7 | W | W | W | W | W | 24.1 | 25.8 | 37.2 | 22.5 |
| 1988 | 23.2 | 34.0 | 48.9 | 76.8 | 26.4 | 25.0 | 59.1 | 22.2 | 31.2 | 25.6 | 28.9 | 24.5 |
| 1989 | 24.3 | 52.0 | 30.2 | 27.7 | 34.3 | 34.6 | 102.5 | 107.1 | 69.8 | 134.7 | 48.9 | 50.3 |
| 1990 | 217.3 | 66.6 | 68.9 | 68.4 | 65.9 | 106.2 | 83.1 | 110.9 | 95.6 | 75.1 | 82.6 | 97.6 |
| 1991 | 179.7 | 69.4 | 64.5 | 83.0 | 103.5 | 81.3 | 70.1 | 70.1 | 62.9 | 66.8 | 100.6 | 107.8 |
| 1992 | 160.0 | 51.7 | 46.6 | 50.4 | 45.9 | 200.1 | 60.2 | 92.2 | 57.7 | 53.8 | 49.1 | 97.2 |
| 1993 | 46.3 | 54.4 | 117.1 | 106.5 | 218.4 | 59.7 | 203.0 | 179.8 | 74.8 | 70.8 | 79.6 | 89.2 |
| 1994 | 156.9 | 95.6 | 86.4 | 74.7 | 135.8 | 149.5 | 80.6 | 94.4 | 142.9 | 96.1 | 114.1 | 126.2 |
| 1995 | 96.1 | 103.3 | 138.5 | 159.6 | 146.4 | 170.0 | 115.0 | 177.5 | 153.8 | 184.3 | 226.8 | 166.7 |
| 1996 | 177.5 | 222.6 | 177.4 | 191.0 | 201.2 | 199.0 | 192.0 | 195.1 | 188.3 | 231.5 | 197.0 | 219.0 |
| 1997 | 231.1 | 319.6 | 287.2 | 292.4 | 421.2 | 375.6 | 301.0 | 279.0 | 304.2 | 300.8 | 274.6 | 416.9 |
| 1998 | 314.4 | 314.1 | 319.3 | 252.1 | 260.2 | 270.3 | 282.5 | 276.6 | 314.6 | 283.5 | 463.1 | 272.2 |
| 1999 | 297.8 | 301.7 | 317.0 | 318.6 | 284.2 | 267.8 | 229.0 | 361.0 | 233.5 | 250.5 | 215.4 | 243.3 |
| 2000 | 227.1 | 267.8 | 230.7 | 257.9 | 231.8 | 237.5 | 255.3 | 299.6 | 281.0 | 328.6 | 266.9 | 283.9 |
| 2001 | 280.8 | 290.2 | 275.0 | 305.7 | 296.1 | 286.4 | 241.7 | 315.0 | 567.9 | 501.4 | 528.1 | 490.2 |
| 2002 | 166.6 | 173.0 | 195.6 | 270.1 | 234.0 | 169.3 | 338.6 | 148.1 | 160.5 | 180.7 | 153.8 | 443.6 |
| 2003 | 275.2 | 257.6 | 509.7 | 252.7 | 239.5 | 218.2 | 225.6 | 213.8 | 324.6 | 313.3 | 243.8 | 260.8 |
| 2004 | 215.7 | 249.2 | 284.4 | 249.3 | 358.4 | 431.7 | 291.5 | 290.7 | 213.7 | 355.6 | 221.4 | 226.5 |
| 2005 | 199.6 | 224.1 | 219.7 | 212.7 | 278.2 | 178.4 | 146.8 | 319.0 | 204.7 | 319.8 | 615.3 | 296.3 |
| 2006 | 245.7 | 202.6 | 157.8 | 345.5 | 236.8 | 208.5 | 150.1 | 163.9 | 278.2 | 179.9 | 160.1 | 168.0 |
| 2007 | 193.2 | 220.0 | 214.7 | 179.8 | 163.6 | 180.5 | 206.2 | 229.2 | 165.4 | 185.3 | 182.2 | 176.2 |
| 2008 | 128.8 | 137.0 | 151.3 | 173.5 | 169.5 | 132.1 | 180.5 | 167.3 | 151.9 | 174.5 | 168.0 | 214.5 |
| 2009 | 144.8 | 169.9 | 160.1 | 153.2 | 149.7 | 152.4 | 123.3 | 110.3 | 101.5 | 114.4 | 105.8 | 111.7 |
| 2010 | 97.9 | 113.8 | 105.9 | 113.6 | 209.8 | 153.8 | 120.3 | 128.2 | 129.1 | 122.7 | 109.7 | 110.6 |
| 2011 | 111.2 | 110.0 | 98.9 | W | 102.4 | 123.4 | 127.2 | W | W | 110.1 | 110.4 | 106.3 |
| 2012 | 75.1 | 90.3 | 101.3 | W | W | 80.4 | 65.8 | 74.6 | 83.1 | 92.2 | W | 86.3 |
| 2013 | 61.3 | 42.7 | 55.0 | 58.6 | 60.6 | W | 68.4 | W | W | W | W | 101.1 |
| 2014 | W | W | W | 96.4 | W | W | W | 104.5 | W | 91.3 | W | W |
| 2015 | W | W | W | 86.3 | 115.5 | 129.9 | 145.2 | 104.7 | 121.8 | 109.5 | W | 93.8 |
| 2016 | W | 101.3 | 125.3 | 165.4 | 156.0 | 189.5 | 164.5 | 167.3 | 170.1 | 125.0 | 88.3 | 102.2 |
| 2017 | 81.5 | 81.4 | 85.7 | 87.3 | 92.2 | 91.1 | 89.2 | 107.6 | 124.9 | 94.0 | 76.2 | W |
| 2018 | 76.0 | 76.6 | 91.5 | 82.4 | W | W | 91.0 | 90.1 | 108.7 | 72.7 | 71.2 | 65.3 |
| 2019 | 61.9 | W | 56.5 | W | 55.9 | W | 59.2 | 67.5 | 71.8 | W | 55.0 | 56.7 |
| 2020 | W | W | W | 18.2 | 27.1 | 36.4 | W | 28.8 | 27.4 | 29.5 | 42.7 | 43.8 |
| 2021 | 39.3 | 39.3 | 40.6 | 45.4 | 47.3 | 60.9 | 106.2 | 119.8 | 62.0 | 144.6 | 87.4 | 110.3 |
| 2022 | 84.8 | 89.4 | 110.2 | |||||||||
| - = No Data Reported; -- = Not Applicable; NA = Not Available; W = Withheld to avoid disclosure of individual company data. |
| Release Date: 6/1/2022 |
| Next Release Date: TBD |