|
Download Data (XLS File) |
|
||||||||
|
||||||||
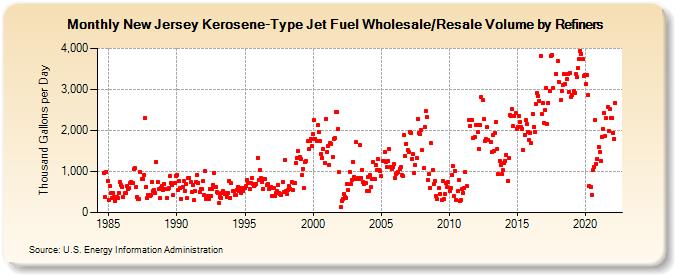
| New Jersey Kerosene-Type Jet Fuel Wholesale/Resale Volume by Refiners (Thousand Gallons per Day) | ||||||||
| Year | Jan | Feb | Mar | Apr | May | Jun | Jul | Aug | Sep | Oct | Nov | Dec |
|---|---|---|---|---|---|---|---|---|---|---|---|---|
| 1984 | 956.0 | 368.8 | 989.8 | 777.5 | ||||||||
| 1985 | 311.2 | 636.3 | 479.5 | 349.7 | 475.7 | 388.3 | 286.7 | 380.7 | 342.9 | 477.0 | 740.5 | 677.0 |
| 1986 | 624.9 | 381.9 | 469.4 | 487.5 | 638.1 | 572.2 | 592.1 | 720.0 | 755.8 | 727.6 | 1,056.0 | 1,074.4 |
| 1987 | 617.0 | 385.0 | 329.1 | 322.7 | 983.6 | 816.0 | 816.5 | 923.4 | 2,306.5 | 634.9 | 345.8 | 436.9 |
| 1988 | 407.5 | 424.4 | 752.9 | 516.3 | 551.5 | 472.1 | 1,238.4 | 756.6 | 571.9 | 343.7 | 603.0 | 649.9 |
| 1989 | 553.8 | 707.4 | 579.1 | 351.1 | 574.2 | 607.5 | 901.4 | 718.3 | 678.2 | 433.8 | 722.3 | 885.0 |
| 1990 | 916.3 | 547.8 | 769.2 | 593.0 | 334.9 | 624.5 | 757.2 | 532.1 | 689.7 | 347.1 | 836.7 | 852.4 |
| 1991 | 735.4 | 496.8 | 673.1 | 294.3 | 535.7 | 752.9 | 917.5 | 718.4 | 491.4 | 579.0 | 579.7 | 760.1 |
| 1992 | 428.0 | 1,009.1 | 340.6 | 415.0 | 323.5 | 563.2 | 398.6 | 566.1 | 673.2 | 971.7 | 629.3 | 489.4 |
| 1993 | 480.7 | 242.1 | 389.4 | 357.5 | 479.6 | 522.1 | 461.5 | 487.5 | 380.3 | 474.1 | 774.4 | 366.2 |
| 1994 | 712.9 | 519.3 | 519.3 | 418.0 | 420.6 | 555.9 | 630.0 | 526.2 | 484.3 | 606.8 | 517.4 | 588.5 |
| 1995 | 608.8 | 649.6 | 788.0 | 717.8 | 568.0 | 722.1 | 853.3 | 697.7 | 638.3 | 673.1 | 696.7 | 1,341.4 |
| 1996 | 794.1 | 1,036.9 | 831.0 | 749.5 | 576.3 | 828.1 | 815.2 | 671.8 | 686.5 | 562.5 | 589.9 | 623.0 |
| 1997 | 402.5 | 596.0 | 396.8 | 471.0 | 535.4 | 679.6 | 467.6 | 450.5 | 418.3 | 733.5 | 502.5 | 1,282.0 |
| 1998 | 526.5 | 449.2 | 554.8 | 636.2 | 585.2 | 749.4 | 551.5 | 715.6 | 711.4 | 1,201.8 | 1,328.1 | 1,504.0 |
| 1999 | 1,355.6 | 1,310.4 | 913.7 | 1,071.3 | 587.2 | 1,223.1 | 1,248.8 | 1,734.6 | 1,539.6 | 1,754.2 | 1,799.0 | 1,619.6 |
| 2000 | 1,920.3 | 2,254.3 | 1,802.3 | 1,744.9 | 2,123.8 | 1,971.9 | 1,747.3 | 1,429.6 | 1,317.6 | 1,547.6 | 1,217.5 | 2,287.5 |
| 2001 | 1,473.4 | 1,622.8 | 1,169.5 | 1,705.5 | 1,674.1 | 1,357.5 | 1,803.9 | 1,814.0 | 2,447.3 | 2,448.7 | 2,037.5 | 980.8 |
| 2002 | 134.0 | 287.8 | 323.4 | 442.6 | 380.3 | 357.5 | 692.9 | 547.9 | 987.3 | 693.0 | 802.0 | 1,243.2 |
| 2003 | 877.2 | 808.6 | 1,712.0 | 841.7 | 806.4 | 1,644.3 | 853.9 | 1,047.3 | 748.7 | 685.2 | 727.7 | 516.6 |
| 2004 | 861.2 | 515.0 | 911.7 | 627.4 | 825.8 | 1,225.8 | 827.7 | 1,154.2 | 1,036.0 | 1,297.4 | 1,044.5 | 1,005.5 |
| 2005 | 884.8 | 1,263.1 | 1,253.9 | 1,479.8 | 1,239.3 | 1,103.6 | 1,252.5 | 1,547.0 | 1,119.5 | 1,050.8 | 1,100.0 | 1,179.3 |
| 2006 | 843.5 | 948.1 | 953.3 | 986.8 | 1,060.9 | 1,104.9 | 917.9 | 883.4 | 1,879.0 | 1,389.8 | 1,678.9 | 1,519.2 |
| 2007 | 1,472.7 | 1,972.7 | 1,927.0 | 1,306.9 | 1,420.7 | 960.0 | 1,153.2 | 1,318.5 | 2,290.5 | 1,931.6 | 1,907.2 | 2,015.3 |
| 2008 | 1,515.2 | 1,084.5 | 2,077.5 | 2,463.8 | 2,327.2 | 793.4 | 933.8 | 604.2 | 1,682.8 | 1,027.6 | 687.5 | 760.8 |
| 2009 | 413.4 | 318.9 | NA | 588.8 | 461.6 | 298.2 | 775.2 | 323.9 | 463.5 | 708.8 | 619.1 | 735.2 |
| 2010 | 521.5 | 610.3 | 915.1 | 1,136.1 | 395.7 | 1,019.9 | 308.5 | 518.0 | 805.0 | 289.1 | 306.5 | 563.1 |
| 2011 | 480.0 | 606.2 | 981.1 | 644.8 | NA | 2,260.8 | 2,118.5 | 2,261.1 | 2,253.0 | 1,817.2 | 1,846.8 | 2,128.2 |
| 2012 | 2,124.3 | 1,955.1 | 1,553.4 | 2,126.3 | 2,821.5 | 2,747.6 | 2,279.9 | 1,737.2 | 1,798.6 | 2,072.5 | 1,777.6 | NA |
| 2013 | 1,708.5 | 1,474.6 | 1,889.0 | 1,501.1 | 1,935.6 | 2,213.0 | 1,554.3 | 940.1 | 1,265.6 | 1,156.6 | 929.2 | 1,027.3 |
| 2014 | 1,218.2 | 1,261.6 | 1,402.4 | 777.5 | 1,339.2 | 2,375.7 | 2,351.3 | 2,515.7 | 2,108.2 | 2,355.2 | 2,416.5 | 2,045.9 |
| 2015 | 2,096.8 | 2,357.4 | 2,209.1 | 2,082.4 | 2,036.0 | 1,513.9 | 1,878.4 | 2,249.1 | 2,147.6 | 1,971.7 | 1,770.4 | 1,949.4 |
| 2016 | 1,685.6 | 2,404.6 | 2,091.0 | 1,959.1 | 2,639.3 | 2,907.8 | 2,837.2 | 2,726.7 | 3,825.5 | 2,389.3 | 2,675.3 | 2,187.6 |
| 2017 | 2,499.6 | 3,030.1 | 2,152.1 | 2,675.4 | 2,962.6 | 3,817.4 | 3,840.5 | 3,023.2 | W | W | 3,387.0 | 3,702.8 |
| 2018 | 3,190.6 | NA | 2,740.5 | 2,958.8 | 3,098.2 | 3,371.3 | 3,124.9 | 3,246.4 | 3,380.6 | 2,939.9 | 3,396.0 | 2,823.3 |
| 2019 | 2,874.2 | 2,953.4 | 2,912.7 | 3,379.5 | 3,294.5 | 3,513.6 | 3,748.5 | 3,937.3 | 3,873.8 | 3,743.6 | 3,328.4 | 3,356.0 |
| 2020 | 3,122.6 | 3,348.5 | 2,853.1 | 636.4 | 628.3 | 435.0 | 1,026.5 | 1,101.2 | 2,250.6 | 1,180.0 | 1,310.3 | 1,605.3 |
| 2021 | 1,474.8 | 1,265.9 | 1,843.7 | 2,028.4 | 2,432.4 | 1,858.9 | 2,301.9 | 2,573.1 | 1,998.2 | 2,529.1 | 2,300.2 | 2,295.0 |
| 2022 | 1,941.5 | 1,798.4 | 2,672.9 | |||||||||
| - = No Data Reported; -- = Not Applicable; NA = Not Available; W = Withheld to avoid disclosure of individual company data. |
| Release Date: 6/1/2022 |
| Next Release Date: TBD |