|
Download Data (XLS File) |
|
||||||||
|
||||||||
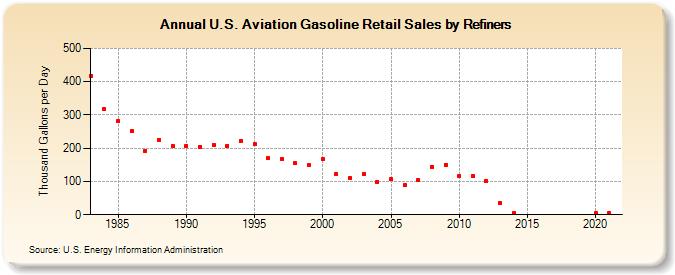
| U.S. Aviation Gasoline Retail Sales by Refiners (Thousand Gallons per Day) | ||||||||
| Decade | Year-0 | Year-1 | Year-2 | Year-3 | Year-4 | Year-5 | Year-6 | Year-7 | Year-8 | Year-9 |
|---|---|---|---|---|---|---|---|---|---|---|
| 1980's | 418.5 | 316.5 | 281.3 | 251.7 | 193.0 | 225.9 | 206.8 | |||
| 1990's | 207.0 | 204.8 | 210.6 | 207.8 | 222.9 | 212.4 | 169.3 | 167.6 | 154.0 | 148.1 |
| 2000's | 166.1 | 122.7 | 110.1 | 121.8 | 98.5 | 106.1 | 88.6 | 103.5 | 144.3 | 150.9 |
| 2010's | 116.6 | 117.5 | 101.0 | 35.9 | 6.4 | W | W | W | W | W |
| 2020's | 4.0 |
| - = No Data Reported; -- = Not Applicable; NA = Not Available; W = Withheld to avoid disclosure of individual company data. |
| Release Date: 6/1/2022 |
| Next Release Date: TBD |