|
Download Data (XLS File) |
|
||||||||
|
||||||||
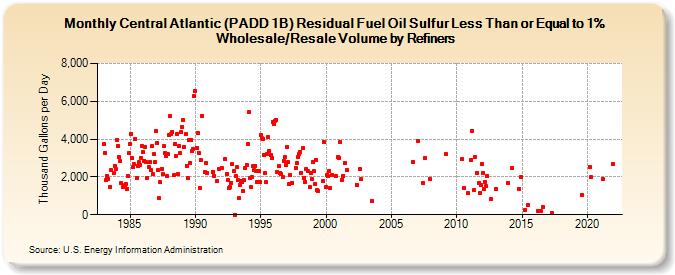
| Central Atlantic (PADD 1B) Residual Fuel Oil Sulfur Less Than or Equal to 1% Wholesale/Resale Volume by Refiners (Thousand Gallons per Day) | ||||||||
| Year | Jan | Feb | Mar | Apr | May | Jun | Jul | Aug | Sep | Oct | Nov | Dec |
|---|---|---|---|---|---|---|---|---|---|---|---|---|
| 1983 | 3,724.0 | 3,265.0 | 1,817.4 | 2,060.1 | 1,903.3 | W | 1,488.6 | 2,361.8 | W | 2,184.6 | 2,567.7 | 2,411.3 |
| 1984 | 3,969.3 | 3,656.5 | 3,066.0 | 2,834.4 | 1,663.6 | W | 1,481.1 | 1,562.9 | 1,629.9 | 1,377.3 | 2,041.8 | 3,249.6 |
| 1985 | 3,750.2 | 4,285.9 | 2,991.9 | 2,504.2 | 2,656.9 | 4,010.8 | 1,942.5 | 2,573.4 | 2,762.2 | 2,624.1 | 3,023.5 | 3,657.3 |
| 1986 | 3,310.3 | 2,864.0 | 3,607.5 | 2,764.6 | 1,949.7 | 2,506.0 | 2,774.7 | 2,360.9 | 3,618.4 | 2,139.7 | 3,202.7 | 2,771.2 |
| 1987 | 4,432.2 | 3,802.1 | 2,360.8 | 861.9 | 1,709.3 | 2,438.3 | 2,148.9 | 3,611.3 | 3,258.6 | 3,129.5 | 2,058.6 | 3,198.3 |
| 1988 | 4,224.0 | 5,197.1 | 4,258.1 | 4,401.4 | 2,083.0 | 3,745.9 | 3,117.1 | 4,260.4 | 2,151.9 | 3,645.1 | 3,242.9 | 4,372.3 |
| 1989 | 4,658.9 | 5,018.7 | 3,607.1 | 4,255.7 | 2,600.6 | 1,916.5 | 3,933.8 | 2,746.3 | 3,978.4 | 3,379.4 | 3,465.4 | 6,275.9 |
| 1990 | 6,541.8 | 3,539.6 | 4,332.5 | 3,282.6 | 1,396.5 | 2,919.2 | 5,236.5 | W | W | 2,257.2 | 2,727.1 | 2,229.9 |
| 1991 | W | W | W | W | 2,275.9 | 2,057.4 | W | W | 1,779.7 | W | 2,402.5 | W |
| 1992 | 2,476.9 | W | W | 2,936.3 | W | 2,159.3 | 1,818.9 | 1,401.4 | 1,444.4 | 1,699.2 | 2,674.0 | 2,303.3 |
| 1993 | 0.0 | 2,058.0 | 2,503.9 | 1,824.9 | 865.2 | 1,565.7 | 1,795.2 | 1,750.9 | 1,251.6 | 1,811.6 | 2,495.6 | 2,631.2 |
| 1994 | 3,719.8 | 5,429.5 | 1,966.0 | 1,470.5 | 1,976.4 | 2,560.2 | 2,370.5 | 2,579.1 | 2,310.3 | 1,718.7 | 2,305.1 | 1,722.7 |
| 1995 | 4,208.0 | 4,035.9 | 4,012.1 | 3,156.1 | 2,227.7 | 1,715.1 | 3,202.2 | 4,088.7 | 3,392.8 | 3,160.3 | 2,986.5 | 4,911.4 |
| 1996 | 4,821.9 | 4,972.7 | 5,024.8 | 2,239.6 | W | 2,572.8 | 2,223.3 | 2,154.9 | 1,999.0 | 2,837.6 | 3,038.9 | 2,643.9 |
| 1997 | 3,604.5 | 2,779.3 | 1,606.0 | 2,117.5 | W | 1,700.5 | W | W | 2,465.1 | 2,720.1 | 3,058.6 | 3,187.2 |
| 1998 | 3,308.5 | 2,224.8 | W | 3,510.6 | 1,961.3 | 1,754.5 | 2,431.1 | 2,289.9 | W | 1,448.3 | 2,193.2 | 1,863.8 |
| 1999 | 2,811.6 | 2,296.1 | 1,613.4 | 2,902.1 | 1,306.1 | 1,243.4 | W | W | W | 1,769.9 | 3,856.8 | W |
| 2000 | 1,475.5 | 2,120.6 | 2,034.2 | 2,335.9 | 1,412.8 | 2,076.8 | W | W | W | 2,067.4 | W | 3,043.2 |
| 2001 | 3,005.9 | 3,833.7 | W | 1,861.8 | 2,062.3 | 2,734.2 | W | 2,385.8 | W | W | W | W |
| 2002 | W | W | W | W | 1,588.1 | W | W | 2,402.5 | 1,867.7 | W | W | W |
| 2003 | W | W | W | W | W | W | 729.4 | W | W | W | W | W |
| 2004 | W | W | W | W | W | W | W | W | W | W | W | W |
| 2005 | W | W | W | W | W | W | W | W | W | W | W | W |
| 2006 | W | W | W | W | W | W | W | W | 2,807.9 | W | W | W |
| 2007 | 3,921.9 | W | W | W | W | 1,676.0 | W | 3,018.6 | W | W | W | 1,887.8 |
| 2008 | W | W | W | W | W | W | W | W | W | W | W | W |
| 2009 | W | W | 3,202.9 | W | W | W | W | W | W | W | W | W |
| 2010 | W | W | W | W | W | 2,942.6 | W | 1,428.8 | W | W | 1,122.7 | W |
| 2011 | W | 2,906.4 | 4,428.8 | W | 1,298.8 | 3,048.5 | W | 2,231.7 | 1,655.5 | 1,153.4 | 1,562.1 | 2,703.0 |
| 2012 | 2,183.1 | 1,349.9 | 1,754.1 | 1,503.4 | 2,052.7 | W | W | 812.3 | W | W | W | W |
| 2013 | 1,352.5 | W | W | W | W | W | W | W | W | W | W | 1,674.3 |
| 2014 | W | W | W | 2,462.7 | W | W | W | W | W | 1,366.2 | W | 1,983.8 |
| 2015 | W | W | W | 250.1 | W | 522.4 | W | W | W | W | W | W |
| 2016 | W | W | W | 213.6 | W | 170.8 | W | 429.8 | W | W | W | W |
| 2017 | W | W | W | 116.7 | W | W | W | W | W | W | W | W |
| 2018 | W | W | W | W | W | W | W | W | W | W | W | W |
| 2019 | W | W | W | W | W | W | W | 1,043.9 | W | W | W | W |
| 2020 | NA | W | 2,506.4 | 1,993.7 | W | W | W | W | W | W | W | W |
| 2021 | W | W | 1,891.4 | W | W | W | W | W | W | W | W | 2,679.1 |
| 2022 | W | W | W | |||||||||
| - = No Data Reported; -- = Not Applicable; NA = Not Available; W = Withheld to avoid disclosure of individual company data. |
| Release Date: 6/1/2022 |
| Next Release Date: TBD |