|
Download Data (XLS File) |
|
||||||||
|
||||||||
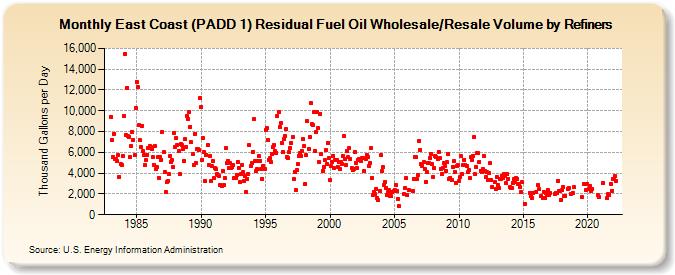
| East Coast (PADD 1) Residual Fuel Oil Wholesale/Resale Volume by Refiners (Thousand Gallons per Day) | ||||||||
| Year | Jan | Feb | Mar | Apr | May | Jun | Jul | Aug | Sep | Oct | Nov | Dec |
|---|---|---|---|---|---|---|---|---|---|---|---|---|
| 1983 | 9,435.6 | 7,185.5 | 5,594.5 | 7,809.5 | 5,398.9 | 5,326.0 | 5,122.1 | 5,737.1 | 3,646.1 | 4,869.5 | 4,802.0 | 5,685.4 |
| 1984 | 9,452.8 | 15,439.1 | 7,712.5 | 12,231.6 | 7,547.1 | 7,519.7 | 5,550.0 | 6,604.5 | 7,938.2 | 7,163.8 | 5,717.1 | 10,302.6 |
| 1985 | 12,813.4 | 12,254.9 | 8,586.7 | 7,145.7 | 6,484.9 | 8,537.0 | 6,117.4 | 5,716.4 | 4,767.1 | 5,226.5 | 5,783.6 | 6,440.4 |
| 1986 | 6,574.5 | 6,477.3 | 6,306.2 | 5,513.6 | 4,809.1 | 6,583.9 | 4,403.0 | 4,557.9 | 5,547.8 | 3,549.1 | 5,558.4 | 5,306.6 |
| 1987 | 7,945.9 | 6,003.8 | 4,132.8 | 2,187.4 | 3,140.0 | 3,240.8 | 3,928.7 | 5,659.1 | 5,101.0 | 5,234.8 | 4,559.7 | 7,899.1 |
| 1988 | 6,494.2 | 7,375.2 | 6,713.4 | 6,149.8 | 3,920.0 | 6,822.5 | 6,663.1 | 6,287.9 | 5,186.4 | 7,243.6 | 6,543.2 | 9,477.1 |
| 1989 | 9,237.6 | 9,860.1 | 8,464.8 | 6,950.8 | 5,853.1 | 4,767.9 | 7,801.8 | 4,956.3 | 6,320.4 | 6,307.8 | 6,214.7 | 11,229.0 |
| 1990 | 10,349.0 | 5,310.9 | 7,343.6 | 6,055.0 | 3,234.4 | 5,779.4 | 6,690.3 | 4,764.1 | 5,656.3 | 3,245.0 | 4,672.1 | 5,144.5 |
| 1991 | 3,547.0 | 4,534.2 | 4,352.5 | 3,890.6 | 3,779.4 | 3,765.1 | 2,901.7 | 2,758.0 | 4,217.8 | 2,859.0 | 3,537.2 | 6,371.6 |
| 1992 | 4,970.6 | 5,214.8 | 4,452.6 | 4,933.4 | 4,504.3 | 4,557.4 | 4,752.5 | 3,494.7 | 3,522.0 | 3,837.5 | 5,104.2 | 4,520.5 |
| 1993 | 3,150.9 | 3,890.0 | 4,826.8 | 4,114.1 | 3,283.0 | 3,700.5 | 2,188.0 | 3,468.5 | 3,933.0 | 6,675.7 | 4,679.5 | 4,967.4 |
| 1994 | 6,058.5 | 9,190.0 | 5,119.5 | 4,193.5 | 4,400.3 | 5,143.8 | 5,615.4 | 5,182.6 | 4,404.9 | 3,469.2 | 4,697.8 | 4,426.6 |
| 1995 | 8,161.6 | 8,300.9 | 7,221.1 | 5,265.9 | 5,411.3 | 5,042.1 | 5,873.5 | 6,528.9 | 6,711.2 | 6,101.9 | 5,980.5 | 9,493.4 |
| 1996 | 9,921.4 | 8,418.4 | 8,814.9 | 6,945.4 | 6,029.3 | 7,253.3 | 7,562.6 | 8,210.5 | 5,548.1 | 5,470.1 | 6,006.2 | 6,402.3 |
| 1997 | 6,904.7 | 7,488.5 | 3,434.6 | 4,148.4 | 2,372.3 | 4,263.9 | 4,851.4 | 5,695.4 | 5,971.3 | 5,646.8 | 6,117.0 | 7,235.9 |
| 1998 | 6,624.9 | 2,961.1 | 5,723.2 | 8,975.7 | 6,309.0 | 7,516.4 | 10,725.5 | 8,700.9 | 8,614.8 | 9,852.5 | 6,146.4 | 7,912.1 |
| 1999 | 9,917.2 | 8,298.6 | 5,064.5 | 9,734.4 | 5,815.8 | 4,190.9 | 4,600.3 | 5,266.2 | 6,241.7 | 4,833.2 | 6,929.7 | 5,467.3 |
| 2000 | 3,323.6 | 4,678.2 | 5,074.1 | 5,690.8 | 4,506.7 | 5,279.0 | 5,218.4 | 4,614.6 | 5,115.4 | 4,406.9 | 5,073.5 | 4,905.0 |
| 2001 | 5,632.2 | 7,560.0 | 5,350.8 | 4,828.0 | 6,157.7 | 5,506.8 | 6,408.8 | 5,377.4 | 4,493.8 | 4,310.0 | 4,382.4 | 6,066.9 |
| 2002 | 4,984.9 | 4,464.9 | 5,246.5 | 5,375.2 | 5,394.3 | 5,155.4 | 5,450.6 | 5,439.3 | 4,200.5 | 5,355.2 | 5,760.9 | 5,538.4 |
| 2003 | 4,695.0 | 4,962.6 | 6,393.3 | 3,566.5 | 1,937.7 | 2,193.6 | 1,994.1 | 2,498.3 | 1,606.5 | 1,397.4 | 2,257.9 | 5,717.5 |
| 2004 | 4,175.7 | 4,553.4 | 2,858.4 | 3,156.1 | 2,599.0 | 1,930.0 | 2,218.7 | 2,345.2 | 1,780.8 | 1,783.3 | 2,188.9 | 2,259.9 |
| 2005 | 2,386.2 | 2,891.3 | 2,264.8 | 1,492.2 | 836.7 | W | W | W | W | 1,952.7 | 2,578.0 | 3,523.3 |
| 2006 | 1,892.5 | 2,379.8 | W | W | W | 2,328.5 | 3,481.8 | 5,535.6 | 5,522.5 | 3,457.4 | 3,833.7 | 7,119.0 |
| 2007 | 6,239.2 | 4,911.6 | 4,718.0 | 5,050.7 | 4,359.2 | 3,169.5 | 4,084.2 | 5,006.9 | 4,949.6 | 5,441.8 | 5,853.2 | 4,858.3 |
| 2008 | 3,645.4 | 4,513.6 | 5,675.9 | 5,590.5 | 5,336.8 | 6,057.8 | 5,416.7 | 4,437.1 | 3,960.3 | 4,539.6 | 4,980.2 | 4,684.7 |
| 2009 | 4,228.8 | 5,027.8 | 5,873.8 | 3,414.6 | 3,556.6 | 3,348.3 | 4,626.7 | 5,136.6 | 4,124.5 | 3,095.4 | 4,717.3 | 4,739.4 |
| 2010 | 3,223.6 | 3,627.7 | 5,615.1 | 3,913.7 | 4,823.7 | 5,304.8 | 4,766.1 | 4,709.8 | 4,093.8 | 4,326.2 | 3,485.4 | 5,534.9 |
| 2011 | 5,270.1 | 5,695.4 | 7,450.9 | 3,871.0 | 4,623.6 | 5,929.5 | 5,896.3 | 5,109.6 | 4,243.1 | 4,071.2 | 4,399.0 | 5,669.6 |
| 2012 | 4,234.9 | 3,633.2 | 4,062.5 | 3,387.1 | 4,010.3 | 4,935.5 | 3,335.2 | 2,643.3 | W | 3,108.7 | 2,494.0 | 3,614.7 |
| 2013 | 2,864.8 | 2,523.6 | 3,482.4 | 3,439.8 | 3,771.5 | 3,537.9 | 3,879.6 | 3,755.5 | 3,025.5 | 3,872.6 | 3,468.4 | 2,657.0 |
| 2014 | 2,523.9 | 2,581.2 | 3,077.3 | 3,400.2 | 3,159.0 | 3,522.6 | 3,478.1 | 2,996.9 | 2,946.8 | 2,663.4 | 2,166.1 | 3,118.8 |
| 2015 | W | 1,056.2 | W | W | W | W | 2,122.3 | 1,764.4 | 1,624.8 | 2,074.5 | W | W |
| 2016 | 2,182.3 | 2,847.5 | 2,431.8 | W | 1,797.9 | W | 1,604.5 | 2,224.1 | 1,577.6 | 2,091.4 | 1,888.1 | 2,337.0 |
| 2017 | 1,874.4 | 2,062.9 | W | W | W | 1,987.5 | 2,103.4 | 2,121.3 | 3,287.8 | 2,233.9 | 2,315.6 | 1,452.7 |
| 2018 | 2,370.9 | 2,685.4 | 1,791.5 | 1,833.2 | W | 2,474.7 | 2,565.8 | W | 2,040.2 | W | 2,130.1 | 2,626.8 |
| 2019 | W | W | W | W | W | W | 1,725.2 | W | 2,976.2 | W | 2,358.9 | 2,990.4 |
| 2020 | NA | 2,508.4 | 2,756.0 | 2,281.1 | 2,453.5 | W | W | W | W | 1,850.4 | 1,673.3 | W |
| 2021 | W | W | 3,068.6 | W | W | W | 1,578.7 | 1,960.1 | 1,936.9 | 2,979.9 | 2,268.7 | 3,450.6 |
| 2022 | 3,394.0 | 3,700.7 | 3,222.8 | |||||||||
| - = No Data Reported; -- = Not Applicable; NA = Not Available; W = Withheld to avoid disclosure of individual company data. |
| Release Date: 6/1/2022 |
| Next Release Date: TBD |