|
Download Data (XLS File) |
|
||||||||
|
||||||||
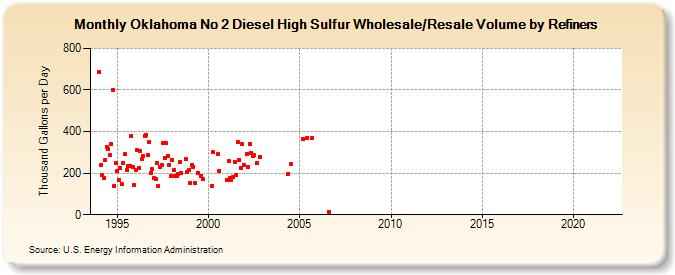
| Oklahoma No 2 Diesel High Sulfur Wholesale/Resale Volume by Refiners (Thousand Gallons per Day) | ||||||||
| Year | Jan | Feb | Mar | Apr | May | Jun | Jul | Aug | Sep | Oct | Nov | Dec |
|---|---|---|---|---|---|---|---|---|---|---|---|---|
| 1994 | 685.0 | 237.4 | 189.3 | 178.7 | 263.5 | 325.4 | 314.7 | 289.2 | 339.0 | 601.6 | 139.6 | 249.8 |
| 1995 | 208.3 | 167.6 | 225.3 | 147.0 | 248.1 | 291.3 | 217.2 | 233.5 | 235.8 | 377.5 | 230.0 | 142.5 |
| 1996 | 217.1 | 309.1 | 225.4 | 306.1 | 266.8 | 283.7 | 378.8 | 385.5 | 289.1 | 350.3 | 199.1 | 219.5 |
| 1997 | 176.6 | 174.0 | 247.9 | 138.2 | 228.3 | 237.9 | 344.4 | 274.6 | 342.9 | 282.6 | 237.6 | 186.5 |
| 1998 | 262.1 | 215.3 | 188.0 | 187.6 | 196.4 | 254.5 | 201.2 | W | W | 266.3 | 204.9 | 215.0 |
| 1999 | 154.7 | 241.0 | 230.7 | 150.8 | W | 202.2 | W | 186.6 | 170.1 | W | W | W |
| 2000 | W | W | 138.0 | 299.6 | W | W | 291.1 | 211.2 | W | W | W | W |
| 2001 | 166.0 | 257.0 | 177.9 | 168.0 | 183.2 | 253.8 | 189.4 | 349.5 | 264.2 | 225.4 | 338.1 | 241.4 |
| 2002 | W | 294.4 | 229.0 | 340.7 | 297.3 | 283.8 | 286.5 | W | 249.1 | W | 279.2 | W |
| 2003 | W | W | W | W | W | W | W | W | W | W | W | W |
| 2004 | W | W | W | W | 193.8 | W | 243.3 | W | W | W | W | W |
| 2005 | W | W | 362.9 | W | W | 370.7 | W | W | 371.1 | W | W | W |
| 2006 | W | W | W | W | W | W | W | 14.0 | W | W | W | W |
| 2007 | W | - | W | W | W | - | - | - | - | - | - | - |
| 2008 | - | - | - | - | - | - | - | - | - | - | - | - |
| 2009 | - | - | - | W | W | W | W | W | W | - | - | - |
| 2010 | - | - | - | - | - | - | - | - | - | - | - | - |
| 2011 | - | - | - | - | - | - | - | - | - | - | - | - |
| 2012 | - | - | - | - | - | - | - | - | - | - | - | - |
| 2013 | - | - | - | - | - | - | - | - | - | - | - | - |
| 2014 | - | - | - | - | - | - | - | - | - | - | - | - |
| 2015 | - | - | - | - | - | - | - | - | - | - | - | - |
| 2016 | - | - | - | - | - | - | - | - | - | - | - | - |
| 2017 | - | - | - | - | - | - | - | - | - | - | - | - |
| 2018 | - | - | - | - | - | - | - | - | - | - | - | - |
| 2019 | - | - | - | - | - | - | - | - | - | - | - | - |
| 2020 | - | - | - | - | - | - | - | - | - | - | - | - |
| 2021 | - | - | - | - | - | - | - | - | - | - | - | - |
| 2022 | - | - | - | |||||||||
| - = No Data Reported; -- = Not Applicable; NA = Not Available; W = Withheld to avoid disclosure of individual company data. |
| Release Date: 6/1/2022 |
| Next Release Date: TBD |