|
Download Data (XLS File) |
|
||||||||
|
||||||||
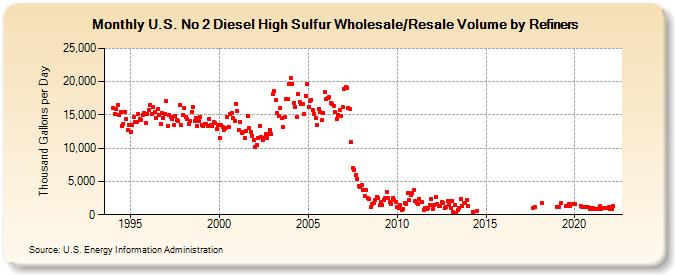
| U.S. No 2 Diesel High Sulfur Wholesale/Resale Volume by Refiners (Thousand Gallons per Day) | ||||||||
| Year | Jan | Feb | Mar | Apr | May | Jun | Jul | Aug | Sep | Oct | Nov | Dec |
|---|---|---|---|---|---|---|---|---|---|---|---|---|
| 1994 | 16,111.7 | 15,206.1 | 15,865.3 | 16,557.7 | 15,022.1 | 15,402.2 | 13,395.6 | 13,688.5 | 15,450.8 | 14,362.0 | 12,730.1 | 13,441.0 |
| 1995 | 12,440.1 | 13,415.5 | 14,655.7 | 13,944.3 | 13,875.0 | 15,064.5 | 14,330.6 | 14,261.3 | 15,054.3 | 15,271.7 | 13,736.2 | 15,171.0 |
| 1996 | 15,679.8 | 16,461.0 | 15,140.6 | 16,159.1 | 15,370.8 | 14,574.4 | 15,871.4 | 15,010.8 | 13,616.1 | 15,215.3 | 14,607.4 | 15,122.0 |
| 1997 | 17,044.2 | 13,406.7 | 14,925.5 | 14,742.2 | 14,379.4 | 13,522.4 | 14,853.6 | 14,193.2 | 14,018.1 | 16,529.8 | 13,508.7 | 14,983.6 |
| 1998 | 16,080.4 | 14,659.8 | 14,380.0 | 13,631.2 | 14,058.6 | 15,431.0 | 16,172.2 | 14,155.1 | 14,543.3 | 13,347.4 | 14,141.1 | 14,631.0 |
| 1999 | 13,471.8 | 13,295.8 | 13,587.6 | 13,653.2 | 13,374.5 | 14,397.9 | 13,504.4 | 13,280.1 | 13,897.9 | 13,735.5 | 12,835.2 | 13,553.3 |
| 2000 | 11,589.8 | 13,454.7 | 13,144.7 | 12,761.6 | 13,004.7 | 14,761.7 | 13,201.3 | 15,089.7 | 15,259.6 | 14,485.9 | 14,129.2 | 16,690.1 |
| 2001 | 15,570.2 | 12,708.1 | 13,953.8 | 12,229.7 | 12,401.8 | 11,538.8 | 12,509.0 | 14,807.3 | 13,007.0 | 12,451.3 | 11,894.8 | 11,260.2 |
| 2002 | 10,150.5 | 10,540.9 | 11,548.0 | 13,407.6 | 11,741.9 | 11,249.8 | 11,498.7 | 12,168.6 | 11,556.3 | 12,059.2 | 12,735.9 | 12,112.5 |
| 2003 | 18,219.4 | 18,580.3 | 17,258.8 | 15,305.6 | 14,798.9 | 15,986.9 | 14,582.6 | 13,248.7 | 14,628.9 | 17,434.4 | 17,370.1 | 19,609.6 |
| 2004 | 20,499.6 | 19,698.6 | 16,811.8 | 16,162.1 | 14,661.5 | 18,156.5 | 16,910.7 | 16,678.8 | 16,702.6 | 15,085.2 | 17,893.1 | 19,618.8 |
| 2005 | 16,185.8 | 17,026.9 | 17,224.0 | 15,712.0 | 15,117.6 | 14,531.6 | 13,438.6 | 15,927.8 | 15,432.6 | 14,174.6 | 15,261.3 | 18,518.2 |
| 2006 | 17,331.9 | 17,501.1 | 17,625.2 | 16,793.3 | 16,587.5 | 16,282.2 | 15,434.5 | 14,419.0 | 15,001.2 | 15,740.1 | 14,850.6 | 16,121.0 |
| 2007 | 18,951.8 | 19,215.6 | 19,029.4 | 16,048.5 | 15,886.3 | 10,873.6 | 7,076.4 | 6,735.5 | 6,004.8 | 5,436.4 | 4,271.0 | 4,166.5 |
| 2008 | 4,485.7 | 3,780.2 | 2,750.4 | 3,748.4 | 2,516.1 | 2,293.0 | 1,116.9 | 1,555.3 | 1,763.3 | 2,230.1 | 2,725.3 | 2,529.6 |
| 2009 | 1,385.1 | 1,840.1 | 1,456.7 | 2,165.4 | 2,514.6 | 3,374.1 | 2,464.0 | 1,914.2 | 1,568.1 | 2,470.0 | 2,187.4 | 1,923.8 |
| 2010 | 1,226.0 | 999.5 | 1,449.8 | 764.7 | 838.1 | 1,809.2 | 1,678.8 | 3,270.1 | 2,190.7 | 3,034.2 | 3,210.9 | 3,732.1 |
| 2011 | 2,024.9 | 1,803.7 | 1,641.9 | 2,295.6 | W | 1,895.6 | 708.9 | 987.0 | 920.5 | 1,016.4 | 1,489.5 | 2,414.0 |
| 2012 | 874.8 | 1,450.2 | 2,691.5 | 1,674.3 | 1,349.2 | 1,322.0 | 1,920.0 | 1,823.9 | 1,031.2 | 1,136.4 | 2,080.1 | 1,404.2 |
| 2013 | 1,045.8 | 2,099.7 | 401.1 | 1,486.9 | 275.9 | 745.2 | 968.9 | 2,428.4 | 1,261.9 | 1,814.4 | 1,827.9 | 2,148.7 |
| 2014 | 1,293.9 | W | W | 436.0 | W | W | 611.2 | W | W | W | W | W |
| 2015 | W | W | W | NA | W | W | W | W | W | W | W | W |
| 2016 | W | W | W | W | W | W | W | W | W | W | W | W |
| 2017 | W | W | W | W | W | W | W | W | 993.1 | 1,086.3 | W | W |
| 2018 | W | W | 1,696.5 | W | W | W | W | W | W | W | W | W |
| 2019 | 1,200.3 | 1,162.0 | W | 1,754.6 | W | W | 1,237.3 | W | 1,542.0 | 1,371.9 | W | 1,542.9 |
| 2020 | 1,556.3 | W | W | W | 1,384.2 | 1,165.4 | 1,169.4 | W | 1,087.6 | 1,094.5 | 928.6 | 1,056.6 |
| 2021 | 978.7 | 785.1 | 849.4 | 899.8 | 832.7 | 1,237.6 | 822.4 | W | 1,051.0 | 936.1 | 1,046.9 | 1,101.1 |
| 2022 | 888.4 | 811.6 | 1,343.5 | |||||||||
| - = No Data Reported; -- = Not Applicable; NA = Not Available; W = Withheld to avoid disclosure of individual company data. |
| Release Date: 6/1/2022 |
| Next Release Date: TBD |