|
Download Data (XLS File) |
|
||||||||
|
||||||||
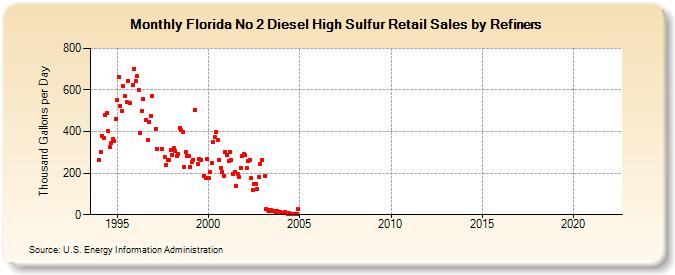
| Florida No 2 Diesel High Sulfur Retail Sales by Refiners (Thousand Gallons per Day) | ||||||||
| Year | Jan | Feb | Mar | Apr | May | Jun | Jul | Aug | Sep | Oct | Nov | Dec |
|---|---|---|---|---|---|---|---|---|---|---|---|---|
| 1994 | 261.0 | 303.8 | 378.8 | 366.9 | 479.4 | 489.0 | 403.7 | 323.5 | 343.8 | 366.1 | 352.5 | 460.1 |
| 1995 | 550.2 | 661.0 | 523.9 | 498.8 | 618.5 | 569.1 | 541.0 | 643.9 | 535.6 | W | 623.2 | 702.5 |
| 1996 | 641.4 | 665.1 | 598.9 | 393.9 | 499.5 | 556.2 | W | 456.8 | 357.1 | 445.0 | 475.4 | 573.4 |
| 1997 | W | 414.1 | 314.9 | W | W | 316.9 | W | 279.1 | 240.3 | 265.4 | 263.9 | 310.2 |
| 1998 | 288.5 | 319.5 | 308.3 | 281.7 | 293.1 | 418.9 | 406.1 | 400.1 | 227.5 | 301.5 | 284.7 | 282.3 |
| 1999 | 231.8 | 253.5 | 264.2 | 505.9 | W | 245.9 | 268.8 | 264.6 | W | 188.2 | 178.3 | 267.7 |
| 2000 | 176.3 | 203.4 | 248.6 | 350.1 | 371.5 | 398.4 | 359.5 | 261.3 | 226.3 | 205.7 | 188.5 | 299.7 |
| 2001 | 289.4 | 257.3 | 300.5 | 262.8 | 194.5 | 205.4 | 140.2 | 196.8 | 179.3 | 225.1 | 284.0 | 291.3 |
| 2002 | 285.8 | 222.9 | 259.4 | 264.1 | 174.4 | 119.7 | 147.5 | 145.4 | 124.1 | 182.0 | 244.0 | 263.8 |
| 2003 | W | 184.9 | 25.6 | 20.7 | 18.9 | 25.0 | 20.2 | 16.5 | 15.1 | 19.7 | 9.9 | 11.7 |
| 2004 | 10.0 | 8.7 | 11.4 | W | 3.7 | 6.4 | 3.5 | 3.7 | 4.4 | 4.4 | 5.1 | 26.0 |
| 2005 | W | W | W | W | W | W | W | W | W | W | W | W |
| 2006 | W | W | W | W | W | W | W | - | - | W | W | W |
| 2007 | W | W | W | W | W | W | W | W | W | W | - | - |
| 2008 | - | - | - | - | - | - | - | - | - | - | - | - |
| 2009 | - | - | - | - | - | - | - | - | - | - | - | - |
| 2010 | - | - | - | - | - | - | - | - | - | - | - | - |
| 2011 | - | - | - | - | - | - | - | - | - | - | - | - |
| 2012 | - | - | - | - | - | - | - | - | - | - | - | - |
| 2013 | - | - | - | - | - | - | - | - | - | - | - | - |
| 2014 | - | - | - | - | - | - | - | - | - | - | - | - |
| 2015 | - | - | - | - | - | - | - | - | - | - | - | - |
| 2016 | - | - | - | - | - | - | - | - | - | - | - | - |
| 2017 | - | - | - | - | - | - | - | - | - | - | - | - |
| 2018 | - | - | - | - | - | - | - | - | - | - | - | - |
| 2019 | - | - | - | - | - | - | - | - | - | - | - | - |
| 2020 | - | - | - | - | - | - | - | - | - | - | - | - |
| 2021 | - | - | - | - | - | - | - | - | - | - | - | - |
| 2022 | - | - | - | |||||||||
| - = No Data Reported; -- = Not Applicable; NA = Not Available; W = Withheld to avoid disclosure of individual company data. |
| Release Date: 6/1/2022 |
| Next Release Date: TBD |