|
Download Data (XLS File) |
|
||||||||
|
||||||||
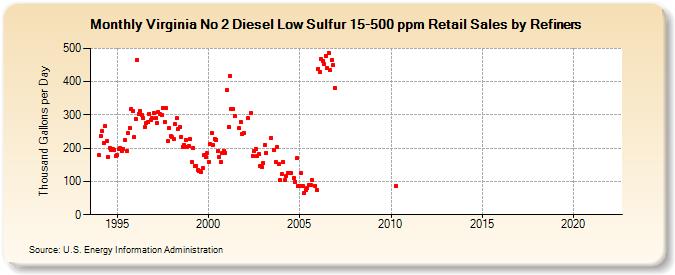
| Virginia No 2 Diesel Low Sulfur 15-500 ppm Retail Sales by Refiners (Thousand Gallons per Day) | ||||||||
| Year | Jan | Feb | Mar | Apr | May | Jun | Jul | Aug | Sep | Oct | Nov | Dec |
|---|---|---|---|---|---|---|---|---|---|---|---|---|
| 1994 | 178.1 | 238.0 | 250.6 | 215.0 | 266.4 | 221.9 | 174.2 | 200.5 | 195.4 | 196.7 | 194.7 | 175.7 |
| 1995 | 178.6 | 197.8 | 199.2 | 190.1 | 198.2 | 224.9 | 190.2 | 244.2 | 260.9 | 317.9 | 311.7 | 233.0 |
| 1996 | 289.0 | 465.4 | 303.0 | 311.3 | 300.3 | 291.1 | 263.0 | 274.5 | 278.8 | 302.8 | 284.5 | 289.4 |
| 1997 | 305.9 | 289.3 | 276.6 | 310.0 | 302.1 | 299.4 | 320.1 | 279.5 | 320.7 | 221.4 | 261.2 | 235.4 |
| 1998 | 232.7 | 226.4 | 271.5 | 290.2 | 259.1 | 262.3 | 234.5 | 203.9 | 210.9 | 225.8 | 204.4 | 205.3 |
| 1999 | 226.6 | 159.0 | 200.9 | 146.5 | 147.4 | 135.2 | 131.5 | 127.9 | 140.8 | 178.2 | 173.4 | 185.0 |
| 2000 | 159.3 | 212.9 | 246.4 | 209.0 | 228.8 | 225.1 | 190.6 | 174.4 | 158.9 | 184.6 | 192.3 | 187.0 |
| 2001 | 373.7 | 263.2 | 418.0 | 318.4 | 316.5 | 296.2 | W | W | 259.6 | 279.3 | 243.7 | 246.5 |
| 2002 | W | W | 289.6 | W | 305.8 | 177.9 | 192.1 | 197.7 | 175.5 | 182.4 | 147.7 | 142.8 |
| 2003 | 154.8 | 210.6 | 184.8 | W | W | 232.0 | W | 193.2 | 158.9 | 204.0 | 151.7 | 103.6 |
| 2004 | 122.5 | 158.9 | 105.6 | 116.2 | 124.6 | 126.2 | 124.1 | W | 110.6 | 99.5 | 169.5 | 85.8 |
| 2005 | 85.4 | 125.8 | 85.7 | 64.4 | 72.8 | 79.5 | 90.7 | 88.1 | 104.3 | W | 86.9 | 74.6 |
| 2006 | 439.5 | 427.8 | 467.7 | 461.7 | 452.0 | 478.4 | 441.0 | 487.2 | 434.1 | 465.8 | 449.7 | 382.1 |
| 2007 | W | W | W | W | W | W | W | W | W | W | W | W |
| 2008 | W | W | W | W | W | W | W | W | W | W | W | W |
| 2009 | W | W | W | W | W | W | W | W | W | W | W | W |
| 2010 | W | W | W | 85.8 | W | W | W | W | - | - | - | - |
| 2011 | - | - | - | - | - | - | - | - | - | - | - | - |
| 2012 | - | - | - | - | - | - | - | - | - | - | W | - |
| 2013 | - | - | - | - | - | - | - | - | - | - | - | - |
| 2014 | - | - | - | - | - | - | - | - | - | - | - | - |
| 2015 | - | - | - | - | - | - | - | - | - | - | - | - |
| 2016 | - | - | - | - | - | - | - | - | - | - | - | - |
| 2017 | - | - | - | - | - | - | - | - | - | - | - | - |
| 2018 | - | - | - | - | - | - | - | - | - | - | - | - |
| 2019 | - | - | - | - | - | - | - | - | - | - | - | - |
| 2020 | - | - | - | - | - | - | - | - | - | - | - | - |
| 2021 | - | - | - | - | - | - | - | - | - | - | - | - |
| 2022 | - | - | - | |||||||||
| - = No Data Reported; -- = Not Applicable; NA = Not Available; W = Withheld to avoid disclosure of individual company data. |
| Release Date: 6/1/2022 |
| Next Release Date: TBD |