|
Download Data (XLS File) |
|
||||||||
|
||||||||
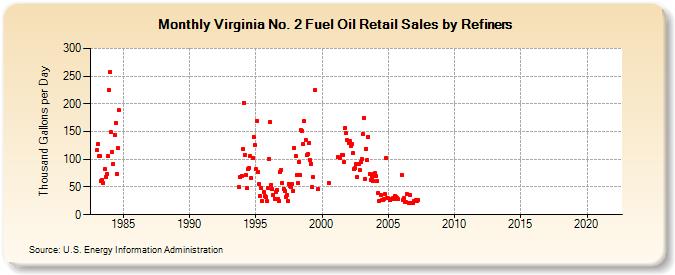
| Virginia No. 2 Fuel Oil Retail Sales by Refiners (Thousand Gallons per Day) | ||||||||
| Year | Jan | Feb | Mar | Apr | May | Jun | Jul | Aug | Sep | Oct | Nov | Dec |
|---|---|---|---|---|---|---|---|---|---|---|---|---|
| 1983 | 116.2 | 127.5 | 105.2 | 105.5 | 60.0 | 62.9 | 58.0 | 82.0 | 68.2 | 73.8 | 105.1 | 224.5 |
| 1984 | 258.0 | 148.7 | 113.0 | 91.7 | 144.3 | 166.2 | 73.2 | 120.4 | 188.0 | |||
| 1993 | 50.4 | 68.2 | 70.5 | |||||||||
| 1994 | 118.3 | 202.0 | 107.9 | 72.5 | 47.3 | 81.6 | 84.4 | 105.5 | 66.2 | 102.4 | 140.2 | 125.1 |
| 1995 | 81.8 | 169.3 | 77.9 | 55.8 | 34.4 | 47.7 | 24.9 | 40.7 | 33.1 | 31.8 | 23.9 | 48.2 |
| 1996 | 100.5 | 168.0 | 53.6 | 45.8 | 34.9 | 29.1 | 41.4 | 44.3 | 28.8 | 25.0 | 77.8 | 81.3 |
| 1997 | 58.0 | 46.4 | 43.1 | 32.6 | 35.4 | 24.1 | 56.3 | 51.8 | 50.2 | 54.9 | 43.5 | 120.6 |
| 1998 | 105.4 | 72.3 | 57.3 | 95.7 | 71.3 | 152.2 | 151.1 | 127.2 | 168.9 | 135.6 | 107.7 | 109.5 |
| 1999 | 129.4 | 99.5 | 92.1 | 49.1 | 67.6 | W | 225.1 | W | 45.9 | W | W | W |
| 2000 | W | W | W | W | W | W | 57.4 | W | W | W | W | W |
| 2001 | W | W | 103.3 | W | 101.5 | W | 108.6 | 108.5 | 95.7 | 157.3 | 146.7 | 134.3 |
| 2002 | 129.2 | 132.4 | 123.2 | 127.5 | 110.5 | 83.2 | 83.5 | 90.7 | 67.5 | 92.0 | 79.8 | 95.2 |
| 2003 | 99.8 | 145.5 | 175.3 | 64.9 | 119.3 | 99.1 | 140.8 | 74.2 | 62.1 | 68.7 | 61.6 | 73.7 |
| 2004 | 75.2 | 69.4 | 60.8 | 38.9 | 24.1 | 35.3 | 27.2 | 26.6 | 27.7 | 37.3 | 102.6 | 29.9 |
| 2005 | 30.0 | W | 25.9 | 28.4 | 29.6 | 29.2 | 34.5 | 32.7 | 29.8 | 27.8 | W | W |
| 2006 | 72.2 | 27.4 | 30.0 | 22.6 | 22.3 | 37.6 | W | 20.9 | 35.6 | 22.0 | 20.7 | 25.1 |
| 2007 | 25.5 | 26.4 | 24.5 | 26.3 | W | W | W | W | W | W | W | W |
| 2008 | W | W | W | W | W | W | W | W | W | W | W | W |
| 2009 | W | W | W | W | W | W | W | W | W | W | W | W |
| 2010 | W | W | W | W | W | W | W | W | W | W | W | W |
| 2011 | W | - | - | - | - | - | W | W | W | W | - | - |
| 2012 | - | - | - | - | - | - | - | - | - | - | - | - |
| 2013 | - | - | - | W | - | - | - | - | - | - | - | - |
| 2014 | - | - | - | - | - | - | - | - | - | - | - | - |
| 2015 | - | - | W | - | W | - | W | - | - | - | - | - |
| 2016 | - | - | - | - | - | - | - | - | - | - | - | - |
| 2017 | - | - | - | - | - | - | - | - | - | - | - | - |
| 2018 | - | - | - | - | - | - | - | - | - | - | - | - |
| 2019 | - | - | - | - | - | - | - | - | - | - | - | - |
| 2020 | - | - | - | - | - | - | - | - | - | - | - | - |
| 2021 | - | - | - | - | - | - | - | - | - | - | - | - |
| 2022 | - | - | - | |||||||||
| - = No Data Reported; -- = Not Applicable; NA = Not Available; W = Withheld to avoid disclosure of individual company data. |
| Release Date: 6/1/2022 |
| Next Release Date: TBD |