|
Download Data (XLS File) |
|
||||||||
|
||||||||
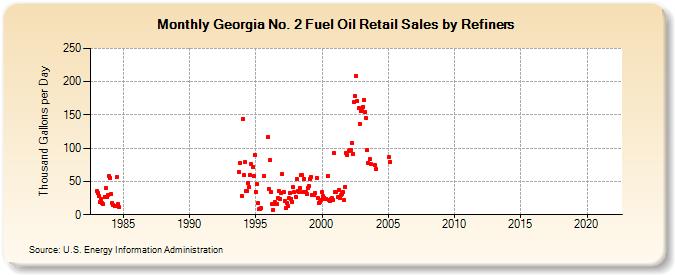
| Georgia No. 2 Fuel Oil Retail Sales by Refiners (Thousand Gallons per Day) | ||||||||
| Year | Jan | Feb | Mar | Apr | May | Jun | Jul | Aug | Sep | Oct | Nov | Dec |
|---|---|---|---|---|---|---|---|---|---|---|---|---|
| 1983 | 35.1 | 33.3 | 28.5 | 19.6 | 23.5 | 17.6 | 16.1 | 27.3 | 39.5 | 27.3 | 28.9 | 57.8 |
| 1984 | 55.9 | 31.1 | 16.9 | 14.6 | 13.7 | 13.2 | 56.8 | 15.6 | 11.1 | |||
| 1993 | 64.2 | 77.8 | 28.6 | |||||||||
| 1994 | 144.3 | 59.3 | 78.5 | 35.4 | 35.0 | 48.4 | 41.6 | 59.8 | 76.1 | 71.9 | 58.1 | 90.1 |
| 1995 | 34.5 | 45.5 | 17.2 | 8.0 | 8.7 | 9.6 | W | 57.5 | W | W | W | 117.1 |
| 1996 | 39.3 | 82.3 | 34.5 | 15.4 | 7.1 | 19.7 | 15.9 | 16.4 | 25.5 | 35.4 | 23.2 | 31.9 |
| 1997 | 60.9 | 34.3 | 20.8 | 10.1 | 17.5 | 12.9 | 24.6 | 33.2 | 24.3 | 19.8 | 41.8 | 33.4 |
| 1998 | 27.2 | 53.4 | 35.1 | 34.5 | 40.5 | 59.6 | 59.5 | 34.5 | 53.7 | 34.7 | 30.4 | 39.5 |
| 1999 | 42.9 | 54.1 | 56.7 | 29.3 | 30.1 | 29.8 | 32.8 | 55.7 | 25.7 | 17.4 | 18.5 | 21.8 |
| 2000 | 34.4 | 27.8 | 25.6 | 23.0 | 24.2 | 58.2 | 22.7 | 20.1 | 23.0 | 24.5 | 22.1 | 92.8 |
| 2001 | 34.5 | 34.8 | 25.9 | 36.4 | 25.6 | 28.9 | 31.6 | 34.1 | 22.0 | 42.3 | 93.4 | 89.5 |
| 2002 | 96.0 | 96.8 | 97.5 | 107.5 | 92.0 | 169.2 | 177.8 | 207.9 | 171.2 | 160.0 | 136.9 | 155.7 |
| 2003 | 155.9 | 162.6 | 172.5 | 154.0 | 144.9 | 96.6 | 77.2 | 83.3 | 76.5 | W | W | W |
| 2004 | 74.6 | 68.1 | W | W | W | W | W | W | W | W | W | W |
| 2005 | W | 86.5 | 79.8 | W | W | W | W | W | W | W | W | W |
| 2006 | W | W | W | W | W | W | W | W | W | W | W | W |
| 2007 | W | W | W | W | W | W | - | W | - | - | W | W |
| 2008 | W | W | W | W | W | - | - | W | W | W | W | W |
| 2009 | W | W | W | W | - | W | - | W | - | - | W | W |
| 2010 | W | W | - | - | - | - | - | - | - | - | - | - |
| 2011 | - | - | - | - | - | - | - | - | - | - | - | - |
| 2012 | - | - | - | - | - | - | - | - | - | - | - | - |
| 2013 | - | - | - | - | - | - | - | - | - | - | - | - |
| 2014 | - | - | - | - | - | - | - | - | - | - | - | - |
| 2015 | - | - | - | - | - | - | - | - | - | - | - | - |
| 2016 | - | - | - | - | - | - | - | - | - | - | - | - |
| 2017 | - | - | - | - | - | - | - | - | - | - | - | - |
| 2018 | - | - | - | - | - | - | - | - | - | - | - | - |
| 2019 | - | - | - | - | - | - | - | - | - | - | - | - |
| 2020 | - | - | - | - | - | - | - | - | - | - | - | - |
| 2021 | - | - | - | - | - | - | - | - | - | - | - | - |
| 2022 | - | - | - | |||||||||
| - = No Data Reported; -- = Not Applicable; NA = Not Available; W = Withheld to avoid disclosure of individual company data. |
| Release Date: 6/1/2022 |
| Next Release Date: TBD |