|
Download Data (XLS File) |
|
||||||||
|
||||||||
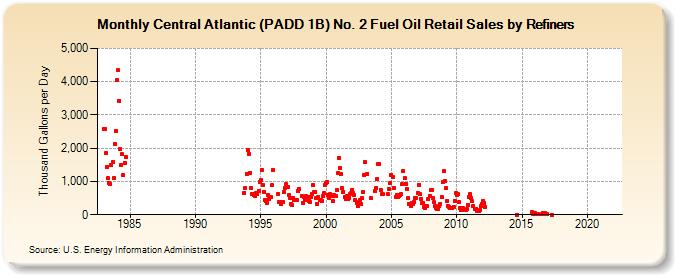
| Central Atlantic (PADD 1B) No. 2 Fuel Oil Retail Sales by Refiners (Thousand Gallons per Day) | ||||||||
| Year | Jan | Feb | Mar | Apr | May | Jun | Jul | Aug | Sep | Oct | Nov | Dec |
|---|---|---|---|---|---|---|---|---|---|---|---|---|
| 1983 | 2,582.1 | 2,577.6 | 1,842.5 | 1,443.5 | 1,095.5 | 940.4 | 924.8 | 1,490.4 | 1,579.6 | 1,108.1 | 2,133.0 | 2,527.7 |
| 1984 | 4,037.3 | 4,340.1 | 3,432.0 | 1,971.3 | 1,507.0 | 1,812.2 | 1,182.5 | 1,563.5 | 1,735.0 | |||
| 1993 | 663.7 | 816.8 | 1,238.9 | |||||||||
| 1994 | 1,956.9 | 1,829.1 | 1,267.0 | 796.8 | 611.7 | 624.1 | 607.2 | 576.3 | 642.6 | 614.2 | 698.6 | 976.6 |
| 1995 | 1,040.2 | 1,345.8 | 898.0 | 685.2 | 452.9 | 418.4 | 352.8 | 604.7 | 457.9 | 519.9 | 885.4 | 1,350.3 |
| 1996 | W | W | W | W | 626.2 | 367.7 | 374.7 | 336.2 | 396.5 | 679.5 | 801.9 | 914.6 |
| 1997 | W | 830.4 | 582.2 | 498.4 | 331.6 | 281.7 | 508.4 | 447.7 | 452.3 | 431.4 | 719.5 | 787.4 |
| 1998 | W | W | 574.5 | 355.5 | 525.2 | 450.4 | 553.6 | 530.5 | 411.6 | 384.7 | 530.7 | 623.4 |
| 1999 | 879.8 | 695.1 | 690.5 | 504.0 | 331.1 | 522.5 | 433.0 | 455.7 | 404.8 | 560.0 | 639.0 | 895.8 |
| 2000 | 941.5 | 974.0 | 580.1 | 504.9 | 610.3 | 551.4 | 425.3 | 594.4 | 552.3 | 563.8 | 749.7 | 1,248.4 |
| 2001 | 1,698.8 | 1,404.1 | 1,218.9 | 793.1 | 683.0 | 527.0 | 462.7 | 551.1 | 464.6 | 516.6 | 622.9 | 645.4 |
| 2002 | 749.1 | 656.8 | 580.1 | 445.9 | 364.6 | 254.0 | 396.5 | 438.8 | 314.4 | 497.4 | 676.3 | 1,187.8 |
| 2003 | 1,571.1 | W | 1,225.3 | W | W | 514.9 | W | W | W | 706.5 | 814.6 | 1,080.3 |
| 2004 | 1,512.8 | 1,517.7 | 751.3 | 621.8 | 614.1 | W | W | W | W | 609.9 | 769.7 | 955.4 |
| 2005 | 1,202.5 | 1,140.3 | 813.0 | W | 535.4 | 591.6 | 538.0 | 568.2 | 604.0 | 622.5 | 914.1 | 1,318.3 |
| 2006 | 1,094.0 | 932.8 | 771.2 | 501.1 | 332.0 | 313.0 | 276.7 | 353.3 | 331.1 | 385.7 | 494.0 | 509.2 |
| 2007 | 657.6 | 898.4 | 610.5 | 476.6 | 340.7 | 353.1 | 228.2 | 206.9 | 259.8 | 261.3 | 457.4 | 573.6 |
| 2008 | 733.0 | 730.0 | 508.4 | 372.1 | 251.0 | 213.8 | 163.8 | 179.5 | 264.2 | 315.0 | 519.4 | 972.8 |
| 2009 | 1,307.5 | 1,003.5 | 797.1 | 406.8 | 273.9 | 239.5 | 202.9 | 198.9 | 213.4 | 239.9 | 413.1 | 651.2 |
| 2010 | 594.6 | 610.8 | 372.7 | 191.0 | 132.9 | NA | 197.0 | 146.9 | 147.9 | 163.1 | 306.9 | 546.3 |
| 2011 | 607.9 | 516.0 | 397.6 | 264.7 | W | 163.0 | 176.2 | 112.5 | 103.9 | 154.2 | 267.6 | 320.2 |
| 2012 | 408.3 | 347.2 | 226.0 | W | W | W | W | W | W | W | W | W |
| 2013 | W | W | W | W | W | W | W | W | W | W | W | W |
| 2014 | W | W | W | W | W | W | W | 1.4 | W | W | W | W |
| 2015 | W | W | W | W | W | W | W | W | W | 76.6 | 25.8 | 30.5 |
| 2016 | 50.2 | 34.2 | 14.4 | 11.5 | W | W | 13.0 | 59.3 | 19.6 | 49.7 | W | 12.1 |
| 2017 | W | W | W | 5.9 | W | W | W | W | W | W | W | W |
| 2018 | W | W | W | W | W | W | W | W | W | W | W | W |
| 2019 | W | W | W | W | W | - | W | W | W | W | W | W |
| 2020 | W | W | W | W | W | W | W | W | - | W | - | - |
| 2021 | - | - | - | - | - | - | - | - | - | - | - | - |
| 2022 | - | - | - | |||||||||
| - = No Data Reported; -- = Not Applicable; NA = Not Available; W = Withheld to avoid disclosure of individual company data. |
| Release Date: 6/1/2022 |
| Next Release Date: TBD |