|
Download Data (XLS File) |
|
||||||||
|
||||||||
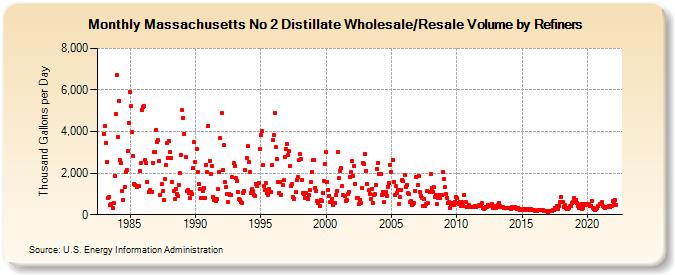
| Massachusetts No 2 Distillate Wholesale/Resale Volume by Refiners (Thousand Gallons per Day) | ||||||||
| Year | Jan | Feb | Mar | Apr | May | Jun | Jul | Aug | Sep | Oct | Nov | Dec |
|---|---|---|---|---|---|---|---|---|---|---|---|---|
| 1983 | 3,902.5 | 4,255.3 | 3,463.2 | 2,530.9 | 794.0 | 833.6 | 470.6 | 517.5 | 312.0 | 568.6 | 1,844.0 | 4,837.5 |
| 1984 | 6,718.3 | 3,755.1 | 5,458.3 | 2,609.7 | 2,481.8 | 1,132.3 | 713.0 | 1,337.1 | 2,060.0 | 2,149.3 | 3,074.4 | 4,404.8 |
| 1985 | 5,901.7 | 5,205.1 | 3,988.4 | 2,838.7 | 1,492.2 | 1,414.8 | 1,327.7 | 1,360.3 | 1,357.1 | 2,112.5 | 2,480.2 | 5,034.9 |
| 1986 | 5,194.7 | 5,219.9 | 2,621.8 | 2,495.2 | 1,579.6 | 1,101.7 | 1,170.3 | 1,079.2 | 1,103.8 | 2,500.3 | 3,021.0 | 3,010.1 |
| 1987 | 4,067.1 | 3,512.7 | 3,580.0 | 2,564.7 | 960.7 | 1,487.5 | 1,118.8 | 697.5 | 1,723.0 | 2,396.1 | 3,429.0 | 2,743.6 |
| 1988 | 3,524.0 | 3,033.0 | 2,709.3 | 1,574.6 | 1,127.7 | 763.5 | 1,232.0 | 985.6 | 903.5 | 1,421.8 | 1,984.3 | 2,896.0 |
| 1989 | 5,012.7 | 4,669.4 | 3,883.8 | 2,757.5 | 1,134.5 | 1,171.5 | 1,047.3 | 788.4 | 1,077.2 | 981.6 | 2,243.5 | 3,507.6 |
| 1990 | 2,535.8 | 3,179.2 | 2,053.1 | 1,486.1 | 1,223.4 | 793.6 | 782.7 | 1,121.1 | 1,307.6 | 818.9 | 2,407.1 | 2,043.6 |
| 1991 | 4,284.0 | 2,604.5 | 1,979.0 | 2,360.5 | 850.6 | 703.5 | 779.6 | 668.9 | 765.3 | 1,220.5 | 2,044.3 | 3,668.9 |
| 1992 | 4,878.0 | 2,135.0 | 3,336.5 | 1,566.3 | 1,326.4 | 980.3 | 631.5 | 1,004.7 | 953.2 | 951.3 | 1,793.7 | 2,498.0 |
| 1993 | 2,340.8 | 1,769.9 | 1,598.2 | 1,112.8 | 744.1 | 706.9 | 613.9 | 582.3 | 1,053.4 | 1,119.8 | 2,140.8 | 2,740.2 |
| 1994 | 3,284.8 | 2,519.5 | 2,042.0 | 1,032.9 | 1,213.3 | 1,151.6 | 949.4 | 895.4 | 1,481.0 | 1,363.0 | 1,526.6 | 3,157.8 |
| 1995 | 3,843.3 | 4,006.6 | 2,377.1 | 1,370.2 | 1,180.2 | 1,517.0 | 1,050.3 | 934.9 | 1,219.9 | 1,089.5 | 2,380.0 | 3,576.7 |
| 1996 | 3,857.1 | 4,896.1 | 3,254.1 | 2,684.5 | 1,555.7 | 1,058.1 | 1,566.0 | 968.1 | 1,408.3 | 1,651.3 | 2,770.2 | 3,164.1 |
| 1997 | 3,402.6 | 2,888.0 | 3,042.9 | 2,363.2 | 1,359.0 | 1,483.4 | 830.1 | 772.4 | 1,102.0 | 1,665.8 | 1,812.7 | 2,628.2 |
| 1998 | 2,898.5 | 2,686.0 | 1,689.0 | 1,062.3 | 990.8 | 816.7 | 1,027.2 | 763.3 | 935.9 | 1,184.5 | 1,549.7 | 2,054.5 |
| 1999 | 2,614.4 | 2,613.8 | 1,307.1 | 1,130.9 | 642.2 | 540.2 | 412.8 | 694.3 | 672.9 | 1,062.7 | 1,620.2 | 2,446.8 |
| 2000 | 2,995.4 | 1,591.3 | 1,209.6 | 895.0 | 601.5 | 759.4 | 488.0 | 559.7 | 551.1 | 949.1 | 1,154.4 | 3,030.9 |
| 2001 | 1,757.0 | 2,105.6 | 2,223.4 | 1,371.3 | 931.4 | 886.6 | 669.4 | 717.5 | 983.9 | 1,112.7 | 1,832.2 | 2,050.8 |
| 2002 | 2,559.8 | 1,872.4 | 2,331.8 | 1,491.6 | 792.7 | 813.0 | 494.7 | 698.8 | 575.7 | 1,303.7 | 2,505.4 | 2,455.3 |
| 2003 | 2,902.7 | 2,115.6 | 1,467.9 | 1,174.7 | 998.9 | 777.4 | 1,254.6 | 557.7 | 948.8 | 973.2 | 1,421.1 | 2,203.7 |
| 2004 | 2,483.1 | 1,942.1 | 1,948.0 | 943.5 | 1,098.4 | 600.1 | 980.5 | 1,098.9 | 909.4 | 1,340.2 | 1,541.9 | 2,410.3 |
| 2005 | 2,047.8 | 2,642.4 | 1,564.1 | 935.5 | 1,362.4 | 1,048.7 | 1,172.4 | 527.1 | 852.7 | 1,186.9 | 1,670.7 | 1,600.4 |
| 2006 | 1,899.7 | 1,335.6 | 1,450.6 | 1,026.1 | 979.2 | 606.3 | 641.2 | 459.5 | 521.7 | 584.8 | 1,145.1 | 1,800.7 |
| 2007 | 1,406.2 | 1,856.3 | 1,108.7 | 884.8 | 806.6 | 435.7 | 769.9 | 412.2 | 509.0 | 1,121.6 | 546.1 | 1,069.3 |
| 2008 | 1,966.1 | 1,287.5 | 1,093.7 | 1,311.7 | 862.0 | 938.8 | 506.7 | 812.5 | 950.2 | 820.0 | 931.3 | 2,060.9 |
| 2009 | 1,741.5 | 1,320.1 | 986.6 | 826.5 | 585.4 | 596.8 | 344.3 | 510.6 | 562.5 | 449.0 | 635.4 | 872.9 |
| 2010 | 802.1 | 573.6 | 518.7 | 620.6 | 437.1 | 595.9 | 421.7 | 969.6 | 620.0 | 369.0 | 371.5 | 451.9 |
| 2011 | 350.7 | 350.5 | 353.1 | 356.9 | 371.7 | 430.5 | 377.6 | 423.9 | 456.4 | 396.5 | 451.5 | 558.8 |
| 2012 | 306.0 | 277.6 | 331.2 | 378.0 | 384.6 | 447.4 | 431.8 | 481.3 | 518.1 | 332.5 | 437.0 | 349.3 |
| 2013 | 331.7 | 350.1 | 476.7 | 574.1 | 402.9 | 358.6 | 349.0 | 343.5 | 325.2 | 338.1 | 335.4 | 321.7 |
| 2014 | 326.7 | 334.3 | 298.6 | 375.7 | 334.4 | 347.6 | 316.2 | 298.1 | 337.3 | 291.8 | 242.9 | 245.1 |
| 2015 | 236.3 | 275.4 | 223.2 | 245.8 | 254.1 | 270.5 | 240.6 | 290.1 | 254.5 | 244.7 | 232.7 | 207.5 |
| 2016 | 198.0 | 183.8 | 171.6 | 214.1 | 229.4 | 215.0 | 238.9 | 211.7 | 194.5 | 181.2 | 181.8 | 176.9 |
| 2017 | 144.3 | 161.6 | 163.8 | 166.0 | 227.1 | 203.5 | 304.2 | 325.0 | 416.9 | 251.5 | 438.3 | 634.1 |
| 2018 | 860.5 | 599.2 | 391.2 | 461.1 | 321.6 | 294.0 | 257.2 | 336.8 | 400.6 | 409.0 | 552.4 | 618.0 |
| 2019 | 807.4 | 683.9 | 559.7 | 421.7 | 346.5 | 361.9 | 499.2 | 289.2 | 299.1 | 528.2 | 458.5 | 522.5 |
| 2020 | 495.2 | 468.1 | 405.6 | 425.2 | 672.3 | 338.4 | 259.8 | 236.5 | 268.9 | 309.8 | 412.6 | 511.2 |
| 2021 | 494.1 | 588.0 | 441.2 | 364.9 | 340.2 | 371.1 | 350.7 | 369.8 | 408.9 | 363.5 | 429.7 | 638.0 |
| 2022 | 608.9 | 717.5 | 486.1 | |||||||||
| - = No Data Reported; -- = Not Applicable; NA = Not Available; W = Withheld to avoid disclosure of individual company data. |
| Release Date: 6/1/2022 |
| Next Release Date: TBD |