|
Download Data (XLS File) |
|
||||||||
|
||||||||
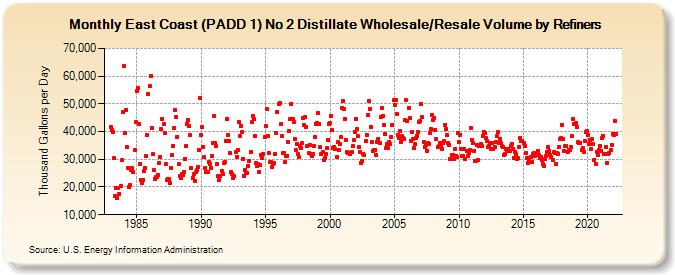
| East Coast (PADD 1) No 2 Distillate Wholesale/Resale Volume by Refiners (Thousand Gallons per Day) | ||||||||
| Year | Jan | Feb | Mar | Apr | May | Jun | Jul | Aug | Sep | Oct | Nov | Dec |
|---|---|---|---|---|---|---|---|---|---|---|---|---|
| 1983 | 41,669.9 | 40,635.9 | 39,793.4 | 30,372.6 | 16,927.9 | 19,657.8 | 16,083.5 | 19,772.5 | 17,627.9 | 20,195.8 | 29,568.3 | 47,101.4 |
| 1984 | 63,678.5 | 39,426.9 | 47,871.4 | 34,391.7 | 26,683.2 | 19,889.5 | 20,816.5 | 26,097.3 | 26,745.4 | 25,357.0 | 33,299.3 | 43,275.2 |
| 1985 | 54,472.9 | 55,819.3 | 42,575.5 | 28,422.8 | 22,567.1 | 21,503.1 | 22,545.7 | 25,636.4 | 26,974.2 | 31,078.0 | 38,651.5 | 53,390.0 |
| 1986 | 56,290.4 | 60,102.1 | 41,346.7 | 31,863.6 | 26,309.2 | 23,025.4 | 23,555.4 | 23,581.9 | 24,185.6 | 28,487.7 | 30,887.0 | 40,805.5 |
| 1987 | 44,616.5 | 42,780.6 | 39,584.1 | 28,365.0 | 22,379.3 | 22,955.5 | 22,763.3 | 21,424.5 | 26,988.4 | 31,539.2 | 34,827.2 | 41,250.0 |
| 1988 | 47,795.9 | 45,408.6 | 38,069.7 | 28,222.3 | 23,966.1 | 23,128.6 | 24,675.5 | 24,393.7 | 25,325.6 | 30,268.4 | 34,809.3 | 42,771.2 |
| 1989 | 44,310.4 | 41,864.1 | 38,639.1 | 26,903.8 | 23,269.4 | 24,557.6 | 22,104.2 | 25,387.2 | 26,005.4 | 27,245.3 | 33,498.7 | 52,091.8 |
| 1990 | 38,715.0 | 41,532.3 | 34,393.9 | 30,709.3 | 26,844.9 | 25,565.6 | 25,341.2 | 28,943.0 | 28,262.6 | 27,028.3 | 31,156.9 | 35,959.1 |
| 1991 | 45,477.6 | 35,906.6 | 34,627.7 | 28,209.2 | 24,098.4 | 22,529.8 | 23,926.8 | 25,929.0 | 24,718.5 | 28,477.7 | 29,052.5 | 36,703.5 |
| 1992 | 44,440.5 | 38,844.9 | 36,487.4 | 32,248.6 | 25,382.2 | 24,702.3 | 23,235.0 | 23,863.6 | 32,588.4 | 30,829.7 | 33,464.1 | 43,458.9 |
| 1993 | 38,536.6 | 42,097.9 | 39,906.6 | 30,097.7 | 24,103.7 | 26,145.7 | 25,025.5 | 24,920.3 | 27,496.1 | 29,529.7 | 32,662.5 | 43,367.9 |
| 1994 | 45,597.3 | 44,353.9 | 38,445.9 | 28,652.2 | 27,724.5 | 28,431.7 | 25,408.9 | 27,834.4 | 31,503.1 | 30,499.2 | 32,027.6 | 38,025.5 |
| 1995 | 42,051.7 | 48,088.7 | 38,278.7 | 32,441.5 | 29,098.3 | 29,064.5 | 27,316.2 | 28,474.3 | 28,825.9 | 31,838.2 | 39,358.5 | 47,177.9 |
| 1996 | 49,764.1 | 50,437.2 | 42,628.1 | 38,349.2 | 32,174.4 | 32,139.8 | 28,903.3 | 31,137.9 | 31,296.4 | 36,281.4 | 40,189.7 | 44,354.9 |
| 1997 | 49,985.8 | 44,604.3 | 43,290.1 | 37,363.4 | 33,405.9 | 35,541.3 | 31,903.5 | 30,697.1 | 34,835.7 | 34,208.6 | 35,703.0 | 44,878.2 |
| 1998 | 42,219.7 | 45,083.2 | 41,661.6 | 34,708.8 | 32,156.3 | 35,216.9 | 31,765.1 | 31,280.5 | 32,032.0 | 34,774.6 | 38,028.8 | 42,775.4 |
| 1999 | 42,964.1 | 46,559.3 | 42,784.1 | 34,320.9 | 32,031.9 | 32,472.0 | 29,906.6 | 30,547.8 | 31,785.4 | 34,014.9 | 36,975.4 | 42,665.4 |
| 2000 | 43,157.5 | 45,693.8 | 40,490.3 | 34,070.6 | 34,512.0 | 33,602.1 | 30,697.3 | 36,111.2 | 33,382.4 | 35,495.2 | 37,856.6 | 48,602.5 |
| 2001 | 50,900.2 | 48,098.8 | 44,572.2 | 37,013.3 | 32,757.0 | 32,286.1 | 32,371.6 | 31,794.2 | 32,789.4 | 34,747.2 | 36,778.2 | 39,860.7 |
| 2002 | 44,478.9 | 40,971.4 | 38,381.2 | 34,499.8 | 32,703.6 | 28,835.5 | 29,301.2 | 32,011.3 | 31,418.2 | 36,562.1 | 38,834.5 | 45,841.2 |
| 2003 | 51,070.6 | 48,163.1 | 41,820.5 | 36,223.4 | 32,937.2 | 33,338.3 | 33,487.3 | 31,581.4 | 36,357.1 | 37,449.8 | 35,831.3 | 45,359.3 |
| 2004 | 48,354.2 | 45,652.5 | 42,363.0 | 39,072.8 | 34,142.6 | 35,329.7 | 34,124.1 | 36,151.3 | 35,494.9 | 38,062.3 | 42,489.4 | 51,293.6 |
| 2005 | 49,677.0 | 51,474.0 | 46,210.2 | 38,810.4 | 37,851.3 | 40,022.7 | 36,066.8 | 38,283.1 | 37,761.6 | 37,228.5 | 44,021.6 | 51,225.4 |
| 2006 | 43,864.1 | 48,654.0 | 44,851.4 | 36,687.6 | 39,776.8 | 37,252.6 | 34,038.8 | 35,463.4 | 37,561.7 | 38,540.6 | 39,849.7 | 43,605.1 |
| 2007 | 43,629.4 | 49,875.0 | 45,087.7 | 36,409.0 | 34,584.2 | 35,100.6 | 33,140.5 | 35,856.4 | 35,346.5 | 39,603.7 | 40,788.0 | 45,982.8 |
| 2008 | 44,049.5 | 45,005.9 | 40,738.9 | 37,231.0 | 34,350.6 | 34,745.3 | 35,890.3 | 34,410.2 | 33,650.3 | 35,875.8 | 36,454.3 | 42,502.3 |
| 2009 | 40,897.7 | 38,755.8 | 35,865.4 | 35,290.4 | 30,116.5 | 31,578.2 | 31,640.5 | 29,925.4 | 33,784.9 | 31,338.0 | 30,686.0 | 39,419.0 |
| 2010 | 36,353.4 | 38,903.9 | 33,612.8 | 31,292.3 | 31,307.5 | 33,856.4 | 29,968.2 | 32,887.5 | 31,077.2 | 32,336.0 | 33,205.7 | 41,439.5 |
| 2011 | 36,878.1 | 35,866.6 | 33,012.3 | 29,242.7 | 29,302.3 | 35,036.0 | 29,733.2 | 34,826.9 | 35,403.6 | 34,817.8 | 38,439.9 | 39,897.9 |
| 2012 | 39,444.3 | 37,618.8 | 36,659.0 | 34,354.2 | 34,880.1 | 35,840.0 | 33,552.7 | 35,907.3 | 33,827.4 | 34,502.3 | 36,279.4 | 38,295.8 |
| 2013 | 39,784.0 | 36,010.6 | 37,217.7 | 35,729.5 | 34,622.7 | 34,364.8 | 31,679.4 | 32,049.0 | 33,741.5 | 32,988.4 | 33,723.9 | 33,069.7 |
| 2014 | 34,754.3 | 35,635.3 | 33,705.3 | 30,392.1 | 32,751.7 | 31,769.7 | 29,990.8 | 30,286.0 | 34,414.0 | 37,801.7 | 36,704.2 | 36,623.2 |
| 2015 | 35,852.3 | 34,928.5 | 32,206.5 | 30,518.5 | 28,682.6 | 29,206.6 | 29,015.3 | 30,742.7 | 28,950.4 | 31,895.1 | 32,257.3 | 31,141.9 |
| 2016 | 31,650.3 | 32,956.9 | 31,606.0 | 30,558.0 | 30,715.5 | 29,558.1 | 28,288.5 | 27,552.3 | 29,959.3 | 31,289.2 | 32,527.0 | 34,300.3 |
| 2017 | 33,131.3 | 31,616.1 | 30,734.3 | 29,615.2 | 32,621.7 | 32,339.1 | 28,318.8 | 32,279.0 | 32,068.5 | 34,354.0 | 37,155.9 | 37,635.0 |
| 2018 | 42,452.9 | 37,304.0 | 33,075.1 | 34,862.6 | 34,731.4 | 32,764.2 | 33,400.7 | 33,295.7 | 34,344.7 | 38,432.5 | 44,576.7 | 42,679.2 |
| 2019 | 42,722.9 | 43,037.6 | 41,516.6 | 36,062.5 | 36,011.0 | 35,925.0 | 33,233.8 | 34,162.8 | 32,602.8 | 36,539.9 | 39,894.3 | 40,039.8 |
| 2020 | 38,858.7 | 35,658.3 | 36,895.1 | 33,830.4 | 37,142.6 | 35,407.8 | 29,841.7 | 28,436.5 | 32,468.8 | 31,485.0 | 33,365.4 | 34,888.8 |
| 2021 | 33,019.3 | 37,596.5 | 38,273.7 | 31,949.6 | 31,995.5 | 34,513.4 | 28,658.2 | 31,770.8 | 32,401.6 | 33,262.7 | 35,310.8 | 39,233.6 |
| 2022 | 38,900.2 | 43,946.4 | 39,270.5 | |||||||||
| - = No Data Reported; -- = Not Applicable; NA = Not Available; W = Withheld to avoid disclosure of individual company data. |
| Release Date: 6/1/2022 |
| Next Release Date: TBD |