|
Download Data (XLS File) |
|
||||||||
|
||||||||
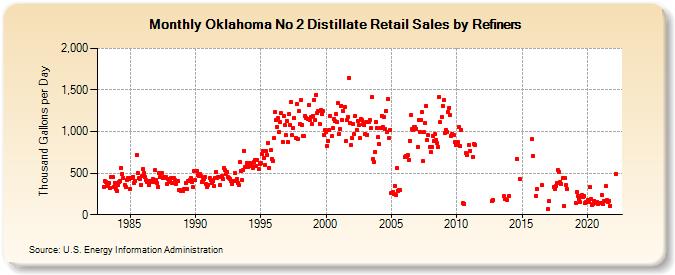
| Oklahoma No 2 Distillate Retail Sales by Refiners (Thousand Gallons per Day) | ||||||||
| Year | Jan | Feb | Mar | Apr | May | Jun | Jul | Aug | Sep | Oct | Nov | Dec |
|---|---|---|---|---|---|---|---|---|---|---|---|---|
| 1983 | 334.8 | 400.1 | 396.3 | 351.1 | 359.6 | 384.0 | 324.4 | 458.1 | 449.8 | 333.5 | 385.6 | 307.7 |
| 1984 | 285.5 | 358.1 | 389.7 | 405.6 | 567.0 | 495.4 | 446.9 | 359.8 | 337.7 | 412.3 | 439.5 | 434.3 |
| 1985 | 309.3 | 445.2 | 440.0 | 458.8 | 376.0 | 408.6 | 721.1 | 506.5 | 438.8 | 424.3 | 363.2 | 466.9 |
| 1986 | 549.8 | 500.5 | 450.8 | 417.3 | 395.1 | 360.5 | 406.8 | 393.2 | 409.3 | 423.8 | 395.3 | 533.7 |
| 1987 | 421.0 | 377.5 | 335.2 | 506.3 | 457.1 | 496.2 | 442.3 | 450.0 | 447.2 | 459.1 | 366.6 | 433.8 |
| 1988 | 396.9 | 413.1 | 446.2 | 376.2 | 439.3 | 422.9 | 367.3 | 401.4 | 410.7 | 293.7 | 298.2 | 284.0 |
| 1989 | 280.6 | 285.5 | 311.3 | 387.3 | 304.6 | 405.4 | 406.2 | 422.5 | 436.3 | 398.3 | 330.8 | 526.7 |
| 1990 | 412.9 | 527.2 | 477.5 | 464.5 | 489.5 | 461.7 | 391.4 | 420.5 | 431.9 | 457.7 | 370.8 | 333.8 |
| 1991 | 362.6 | 439.1 | 417.0 | 384.7 | 405.2 | 342.3 | 444.0 | 517.4 | 440.2 | 448.4 | 449.3 | 357.9 |
| 1992 | 464.0 | 425.8 | 557.1 | 532.9 | 489.5 | 517.7 | 451.5 | 441.7 | 432.2 | 408.7 | 367.0 | 405.9 |
| 1993 | 500.0 | 403.5 | 431.0 | 381.9 | 351.8 | 635.3 | 528.0 | 414.3 | 540.1 | 770.7 | 579.3 | 623.5 |
| 1994 | 573.7 | 614.9 | 619.6 | 606.4 | 589.2 | 563.5 | 639.4 | 659.0 | 590.1 | 652.0 | 548.9 | 613.1 |
| 1995 | 624.5 | 725.1 | 767.3 | 682.0 | 600.6 | 763.4 | 714.1 | 865.5 | 562.7 | 778.5 | 672.3 | 640.5 |
| 1996 | 917.0 | 1,233.6 | 1,144.1 | 1,056.5 | 1,162.9 | 996.6 | 1,113.4 | 1,218.2 | 878.2 | 1,185.5 | 1,075.4 | 952.6 |
| 1997 | 1,130.3 | 870.9 | 1,206.3 | 1,078.1 | 1,354.0 | 955.1 | 1,039.2 | 1,160.4 | 919.5 | 1,331.7 | 906.2 | 1,247.1 |
| 1998 | 1,090.2 | 1,378.5 | 1,083.9 | 952.3 | 942.3 | 1,191.5 | 1,166.6 | 1,146.7 | 1,320.7 | 1,140.8 | 1,171.6 | 1,091.6 |
| 1999 | 1,191.1 | 1,383.1 | 1,143.5 | 1,445.4 | 1,220.0 | 1,242.4 | 1,091.4 | 1,256.6 | 1,217.0 | 1,242.6 | 962.6 | 1,013.6 |
| 2000 | 994.8 | 828.3 | 888.5 | 1,016.8 | 1,192.9 | 941.1 | 1,040.8 | 1,153.4 | 1,131.1 | 1,210.9 | 1,109.4 | 1,338.9 |
| 2001 | 973.5 | 1,030.1 | 1,313.2 | 1,137.3 | 1,249.5 | 1,300.3 | 880.6 | 1,137.5 | 1,179.1 | 1,649.0 | 1,108.8 | 837.9 |
| 2002 | 916.9 | 1,090.8 | 965.1 | 1,190.1 | 1,023.6 | 1,124.3 | 1,078.6 | 922.0 | 1,149.4 | 1,137.4 | 1,087.0 | 1,075.9 |
| 2003 | 969.8 | 1,117.7 | 961.9 | 1,118.0 | 1,139.6 | 1,042.6 | 1,417.8 | 670.5 | 636.4 | 754.8 | 1,118.8 | 1,044.1 |
| 2004 | 930.3 | 849.4 | 1,046.0 | 1,192.1 | 1,056.7 | 1,178.9 | 1,036.6 | 1,246.1 | 1,000.6 | 1,395.1 | 918.2 | 1,018.9 |
| 2005 | 260.2 | 268.1 | 243.9 | 346.2 | 233.9 | 561.6 | 288.7 | 294.3 | 292.5 | W | W | W |
| 2006 | 692.5 | 704.9 | 700.5 | 715.3 | 661.4 | 890.6 | 1,202.9 | 1,026.5 | 1,015.3 | 1,055.3 | 1,049.9 | 1,035.1 |
| 2007 | 816.3 | 1,144.9 | 996.7 | 1,140.7 | 1,229.5 | 642.5 | 990.3 | 1,097.4 | 1,311.8 | 903.4 | 953.7 | 816.5 |
| 2008 | 755.8 | 815.3 | 948.3 | 886.8 | 967.1 | 897.9 | 858.4 | 816.2 | 1,418.2 | 1,110.4 | 1,176.0 | 1,312.5 |
| 2009 | 1,378.7 | 982.8 | 1,019.0 | 1,000.4 | 1,233.2 | 1,287.2 | 1,194.1 | 945.4 | 968.2 | 961.6 | 869.4 | 840.6 |
| 2010 | 841.7 | 870.6 | 1,048.9 | 823.6 | 1,023.6 | NA | 135.2 | 130.3 | 738.5 | 716.7 | W | 843.3 |
| 2011 | 771.0 | W | W | 688.8 | 856.1 | 841.5 | W | W | W | W | W | W |
| 2012 | W | W | W | W | W | W | W | W | 163.5 | 175.5 | W | W |
| 2013 | W | W | W | W | W | W | W | 219.7 | 193.4 | W | 178.1 | W |
| 2014 | 221.2 | W | W | W | W | W | W | 674.4 | W | W | 425.2 | W |
| 2015 | W | W | W | W | W | W | W | W | W | 907.9 | 706.3 | W |
| 2016 | W | 224.7 | 304.6 | W | W | W | 351.3 | W | W | W | W | W |
| 2017 | 65.1 | 159.9 | W | W | W | 332.8 | 310.5 | 343.4 | 382.3 | 533.8 | 512.0 | 394.0 |
| 2018 | 371.7 | 444.1 | 103.6 | 441.2 | 354.1 | 311.7 | W | W | W | W | W | W |
| 2019 | W | 145.9 | 270.9 | 220.6 | 191.3 | 148.9 | 230.3 | 231.6 | 210.3 | 225.0 | 145.3 | 148.2 |
| 2020 | 177.4 | 151.8 | 336.2 | 191.0 | 118.1 | 132.2 | 170.2 | 136.5 | 156.1 | 152.7 | 132.1 | 140.7 |
| 2021 | 136.6 | 241.1 | 123.0 | 166.3 | 168.8 | 341.7 | 172.7 | 153.6 | 169.8 | 109.3 | W | W |
| 2022 | W | W | 495.2 | |||||||||
| - = No Data Reported; -- = Not Applicable; NA = Not Available; W = Withheld to avoid disclosure of individual company data. |
| Release Date: 6/1/2022 |
| Next Release Date: TBD |