|
Download Data (XLS File) |
|
||||||||
|
||||||||
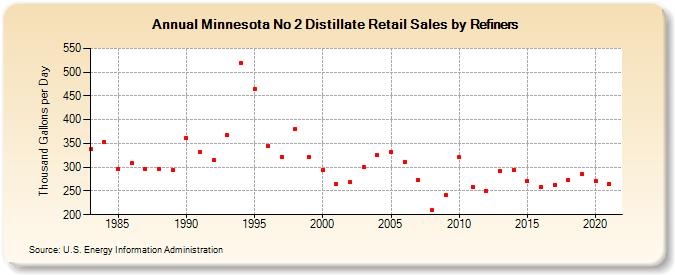
| Minnesota No 2 Distillate Retail Sales by Refiners (Thousand Gallons per Day) | ||||||||
| Decade | Year-0 | Year-1 | Year-2 | Year-3 | Year-4 | Year-5 | Year-6 | Year-7 | Year-8 | Year-9 |
|---|---|---|---|---|---|---|---|---|---|---|
| 1980's | 337.4 | 352.9 | 296.2 | 308.1 | 295.4 | 296.5 | 294.6 | |||
| 1990's | 361.2 | 332.9 | 314.4 | 367.0 | 519.3 | 464.3 | 344.3 | 321.8 | 380.7 | 321.4 |
| 2000's | 293.6 | 265.5 | 268.7 | 299.6 | 325.2 | 332.7 | 311.5 | 273.8 | 209.4 | 240.6 |
| 2010's | 320.8 | 259.1 | 250.0 | 292.9 | 294.9 | 270.4 | 257.5 | 263.0 | 273.0 | 285.4 |
| 2020's | 270.6 |
| - = No Data Reported; -- = Not Applicable; NA = Not Available; W = Withheld to avoid disclosure of individual company data. |
| Release Date: 6/1/2022 |
| Next Release Date: TBD |