|
Download Data (XLS File) |
|
||||||||
|
||||||||
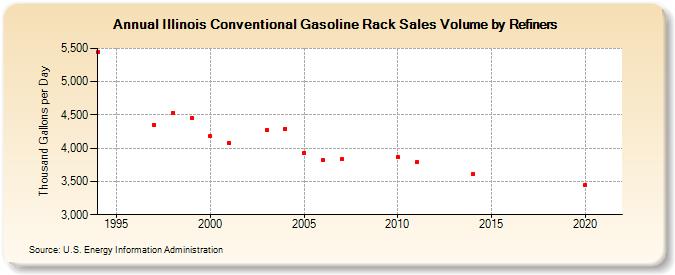
| Illinois Conventional Gasoline Rack Sales Volume by Refiners (Thousand Gallons per Day) | ||||||||
| Decade | Year-0 | Year-1 | Year-2 | Year-3 | Year-4 | Year-5 | Year-6 | Year-7 | Year-8 | Year-9 |
|---|---|---|---|---|---|---|---|---|---|---|
| 1990's | 5,442.0 | W | W | 4,354.3 | 4,535.1 | 4,460.8 | ||||
| 2000's | 4,176.3 | 4,076.5 | W | 4,271.9 | 4,294.2 | 3,934.6 | 3,815.6 | 3,835.4 | W | W |
| 2010's | 3,867.1 | 3,789.0 | W | W | 3,614.2 | W | W | W | W | W |
| 2020's | 3,448.5 |
| - = No Data Reported; -- = Not Applicable; NA = Not Available; W = Withheld to avoid disclosure of individual company data. |
| Release Date: 6/1/2022 |
| Next Release Date: TBD |