|
Download Data (XLS File) |
|
||||||||
|
||||||||
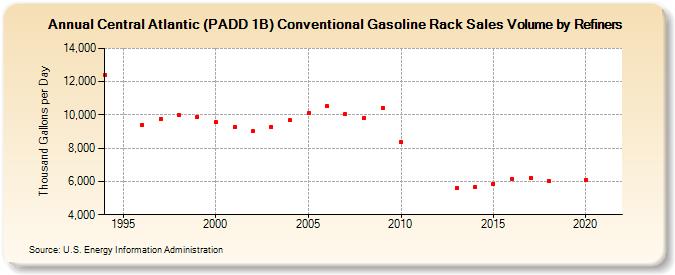
| Central Atlantic (PADD 1B) Conventional Gasoline Rack Sales Volume by Refiners (Thousand Gallons per Day) | ||||||||
| Decade | Year-0 | Year-1 | Year-2 | Year-3 | Year-4 | Year-5 | Year-6 | Year-7 | Year-8 | Year-9 |
|---|---|---|---|---|---|---|---|---|---|---|
| 1990's | 12,396.1 | W | 9,395.9 | 9,758.6 | 9,992.4 | 9,878.7 | ||||
| 2000's | 9,572.5 | 9,268.1 | 9,004.4 | 9,276.3 | 9,670.6 | 10,085.7 | 10,512.3 | 10,030.0 | 9,810.1 | 10,440.9 |
| 2010's | 8,381.0 | W | W | 5,592.8 | 5,679.8 | 5,855.2 | 6,166.8 | 6,206.4 | 6,022.4 | W |
| 2020's | 6,091.1 |
| - = No Data Reported; -- = Not Applicable; NA = Not Available; W = Withheld to avoid disclosure of individual company data. |
| Release Date: 6/1/2022 |
| Next Release Date: TBD |