|
Download Data (XLS File) |
|
||||||||
|
||||||||
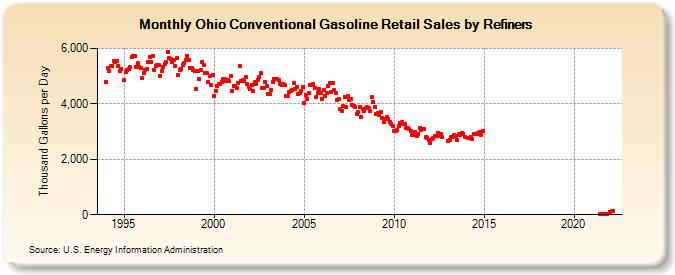
| Ohio Conventional Gasoline Retail Sales by Refiners (Thousand Gallons per Day) | ||||||||
| Year | Jan | Feb | Mar | Apr | May | Jun | Jul | Aug | Sep | Oct | Nov | Dec |
|---|---|---|---|---|---|---|---|---|---|---|---|---|
| 1994 | 4,799.9 | 5,275.6 | 5,173.4 | 5,352.4 | 5,365.7 | 5,528.8 | 5,512.3 | 5,541.5 | 5,369.0 | 5,186.9 | 5,273.2 | W |
| 1995 | 4,845.4 | 5,139.0 | 5,232.9 | 5,261.6 | 5,311.7 | 5,696.2 | 5,719.0 | 5,715.6 | 5,334.0 | 5,461.8 | 5,323.5 | 5,294.9 |
| 1996 | 4,921.1 | 5,094.6 | 5,223.7 | 5,244.2 | 5,515.9 | 5,683.0 | 5,518.0 | 5,718.5 | 5,231.8 | 5,359.2 | 5,392.9 | 5,404.1 |
| 1997 | 5,010.7 | 5,188.6 | 5,338.1 | 5,436.2 | 5,495.5 | 5,881.5 | 5,658.9 | 5,617.0 | 5,520.8 | 5,592.0 | 5,357.0 | 5,647.6 |
| 1998 | 5,026.5 | 5,228.6 | 5,274.1 | 5,410.4 | 5,489.8 | 5,566.1 | 5,740.3 | 5,586.3 | 5,308.7 | 5,299.9 | 5,212.6 | 5,167.5 |
| 1999 | 4,547.1 | 5,167.8 | 4,910.8 | 5,217.9 | 5,500.1 | 5,397.9 | 5,111.5 | 5,100.7 | 4,793.8 | 4,987.4 | 4,678.6 | 5,046.4 |
| 2000 | 4,296.5 | 4,479.2 | 4,657.4 | 4,727.8 | 4,698.1 | 4,777.1 | 4,905.2 | 4,886.7 | 4,838.4 | 4,858.6 | 4,816.7 | 4,997.8 |
| 2001 | 4,476.8 | 4,659.0 | 4,652.1 | 4,578.0 | 4,758.5 | 5,360.3 | 4,825.6 | 4,850.0 | 4,815.6 | 4,962.6 | 4,704.6 | 4,624.6 |
| 2002 | 4,521.2 | 4,687.3 | 4,459.0 | 4,785.0 | 4,729.1 | 4,875.6 | 4,967.1 | 5,121.1 | 4,562.6 | 4,564.5 | 4,801.6 | 4,637.4 |
| 2003 | 4,356.3 | 4,339.8 | 4,485.0 | 4,775.3 | 4,884.6 | 4,905.3 | 4,892.2 | 4,861.5 | 4,714.3 | 4,667.8 | 4,717.6 | 4,673.5 |
| 2004 | 4,294.5 | 4,299.6 | 4,426.3 | 4,473.6 | 4,504.1 | 4,740.2 | 4,522.6 | 4,612.1 | 4,369.1 | 4,394.2 | 4,463.3 | 4,613.7 |
| 2005 | 4,016.6 | 4,334.5 | 4,173.7 | 4,397.8 | 4,668.3 | 4,674.6 | 4,706.5 | 4,566.1 | 4,263.8 | 4,382.6 | 4,522.9 | 4,407.9 |
| 2006 | 4,173.1 | 4,514.0 | 4,299.7 | 4,373.3 | 4,644.0 | 4,747.0 | 4,409.6 | 4,740.9 | 4,494.2 | 4,396.2 | 4,123.6 | 4,177.8 |
| 2007 | 3,804.7 | 3,741.5 | 3,910.0 | 4,261.6 | 3,876.0 | 4,297.1 | 4,144.8 | 4,180.5 | 3,959.7 | 3,935.3 | 3,875.3 | 3,644.5 |
| 2008 | 3,711.3 | 3,878.5 | 3,534.3 | 3,824.4 | 3,736.0 | 3,861.9 | 3,893.1 | 3,863.3 | 3,731.1 | 4,230.8 | 4,076.3 | 3,897.6 |
| 2009 | 3,615.6 | 3,676.7 | 3,603.0 | 3,704.9 | 3,486.1 | 3,327.4 | 3,463.6 | 3,508.4 | 3,446.7 | 3,361.0 | 3,285.9 | 3,192.3 |
| 2010 | 3,013.8 | 3,004.3 | 3,070.9 | 3,198.0 | 3,321.4 | 3,334.3 | 3,260.0 | 3,272.9 | 3,131.0 | 3,113.1 | 3,099.5 | 3,024.8 |
| 2011 | 2,890.8 | 2,864.3 | 2,983.7 | 2,856.4 | 2,913.9 | 3,143.7 | 3,051.4 | 3,087.0 | 3,100.2 | 2,787.8 | 2,775.3 | 2,712.5 |
| 2012 | 2,592.3 | 2,726.1 | 2,753.5 | 2,833.9 | 2,850.0 | 2,964.5 | 2,853.4 | 2,917.1 | 2,788.1 | W | W | W |
| 2013 | 2,674.3 | 2,704.3 | 2,793.4 | 2,819.3 | 2,865.2 | 2,850.2 | 2,685.9 | 2,901.5 | 2,870.0 | 2,946.8 | 2,927.6 | 2,806.0 |
| 2014 | W | 2,768.6 | 2,778.6 | 2,815.5 | 2,734.1 | 2,907.3 | 2,920.4 | 2,922.7 | 2,942.6 | 2,970.7 | 2,870.1 | 3,018.3 |
| 2015 | W | W | W | W | W | W | W | W | W | W | W | W |
| 2016 | W | W | W | W | W | W | W | W | W | W | W | W |
| 2017 | W | W | W | W | W | W | W | W | W | W | W | W |
| 2018 | W | W | W | W | W | W | W | W | W | W | W | W |
| 2019 | W | W | W | W | W | W | W | W | W | W | W | W |
| 2020 | W | W | W | W | W | W | W | W | W | W | W | W |
| 2021 | W | W | W | W | W | 21.9 | W | 22.9 | W | 19.5 | 23.9 | W |
| 2022 | 111.5 | 116.2 | 121.5 | |||||||||
| - = No Data Reported; -- = Not Applicable; NA = Not Available; W = Withheld to avoid disclosure of individual company data. |
| Release Date: 6/1/2022 |
| Next Release Date: TBD |