|
Download Data (XLS File) |
|
||||||||
|
||||||||
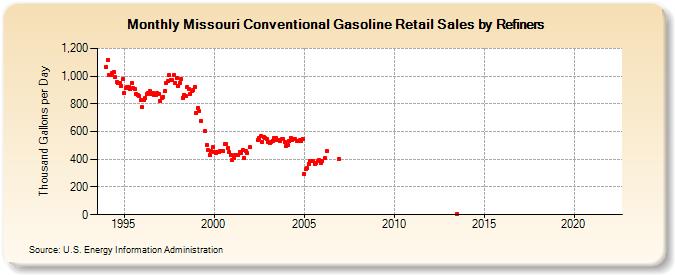
| Missouri Conventional Gasoline Retail Sales by Refiners (Thousand Gallons per Day) | ||||||||
| Year | Jan | Feb | Mar | Apr | May | Jun | Jul | Aug | Sep | Oct | Nov | Dec |
|---|---|---|---|---|---|---|---|---|---|---|---|---|
| 1994 | 1,065.7 | 1,116.4 | 1,007.3 | 1,011.2 | 1,021.8 | 1,030.0 | 992.9 | 958.7 | 948.6 | 950.0 | 931.5 | 977.6 |
| 1995 | 877.9 | 916.7 | 918.1 | 918.7 | 907.3 | 952.7 | 914.2 | 909.1 | 872.8 | 865.6 | 856.9 | 825.4 |
| 1996 | 776.0 | 825.3 | 843.4 | 869.4 | 878.5 | 891.1 | 874.2 | 875.0 | 864.1 | 865.6 | 880.7 | 869.3 |
| 1997 | 822.1 | 842.6 | 852.7 | 891.2 | 947.3 | 961.5 | 1,005.5 | 973.3 | 968.7 | 1,007.7 | 952.8 | 989.6 |
| 1998 | 929.8 | 952.0 | 976.9 | 844.5 | 866.7 | 858.0 | 920.8 | 906.9 | 871.5 | 895.6 | 896.7 | 923.0 |
| 1999 | 735.0 | 770.4 | 747.0 | 677.0 | W | W | 600.9 | 505.0 | 466.7 | 429.4 | 459.7 | 485.0 |
| 2000 | 451.1 | 444.1 | 453.1 | 449.5 | 459.6 | 456.9 | 458.8 | 509.2 | 507.4 | 478.7 | 450.5 | 429.2 |
| 2001 | 397.6 | 407.9 | 428.3 | 429.8 | 429.4 | 452.2 | 448.5 | 466.2 | 410.1 | 456.6 | 442.7 | W |
| 2002 | 485.7 | W | W | W | W | 540.1 | 552.7 | 566.6 | 528.2 | 562.6 | 556.8 | 548.2 |
| 2003 | 522.7 | 517.0 | 526.6 | 534.0 | 554.2 | 554.0 | 540.2 | 540.9 | 528.9 | 543.5 | 545.6 | 525.7 |
| 2004 | 495.3 | 500.2 | 534.9 | 554.8 | 536.6 | 545.1 | 544.4 | 531.4 | 528.8 | 539.0 | 528.8 | 548.8 |
| 2005 | 296.2 | 330.3 | 334.9 | 365.8 | 385.9 | 389.9 | 388.1 | 369.4 | 374.3 | 389.1 | 394.7 | 370.8 |
| 2006 | 384.8 | W | 409.0 | 460.8 | W | W | W | W | W | W | W | 400.9 |
| 2007 | W | W | W | W | W | W | W | W | W | W | W | W |
| 2008 | W | W | W | W | W | W | W | W | W | W | W | W |
| 2009 | W | W | W | W | W | W | W | W | W | W | W | W |
| 2010 | W | W | W | W | W | W | W | W | W | W | W | W |
| 2011 | W | W | W | W | W | W | W | W | W | W | W | W |
| 2012 | W | W | W | W | W | W | NA | W | W | W | W | W |
| 2013 | W | W | W | W | W | W | 5.7 | W | W | W | W | W |
| 2014 | W | W | W | W | W | W | W | W | W | W | W | W |
| 2015 | W | W | W | W | W | W | - | W | W | W | W | W |
| 2016 | W | W | W | W | W | - | - | - | W | W | W | NA |
| 2017 | W | W | W | W | W | W | - | - | W | - | W | W |
| 2018 | W | W | W | W | W | W | W | W | W | W | W | W |
| 2019 | W | W | W | W | W | W | W | W | W | W | W | W |
| 2020 | W | W | W | W | W | W | W | W | W | W | W | W |
| 2021 | W | W | W | W | - | W | W | W | W | W | W | W |
| 2022 | W | W | W | |||||||||
| - = No Data Reported; -- = Not Applicable; NA = Not Available; W = Withheld to avoid disclosure of individual company data. |
| Release Date: 6/1/2022 |
| Next Release Date: TBD |