|
Download Data (XLS File) |
|
||||||||
|
||||||||
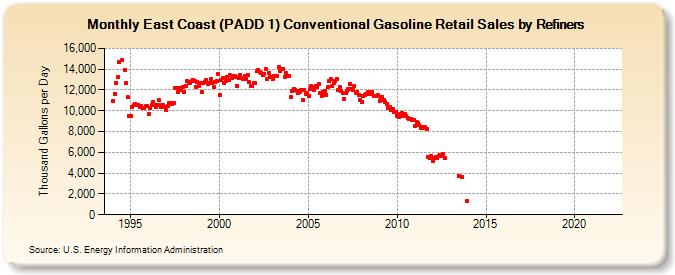
| East Coast (PADD 1) Conventional Gasoline Retail Sales by Refiners (Thousand Gallons per Day) | ||||||||
| Year | Jan | Feb | Mar | Apr | May | Jun | Jul | Aug | Sep | Oct | Nov | Dec |
|---|---|---|---|---|---|---|---|---|---|---|---|---|
| 1994 | 10,921.0 | 11,642.8 | 12,709.5 | 13,207.4 | 14,657.0 | W | 14,854.5 | W | 13,877.2 | 12,645.5 | 11,315.5 | 9,484.4 |
| 1995 | 9,510.3 | 10,362.0 | 10,508.1 | 10,675.3 | 10,522.1 | 10,550.3 | 10,350.0 | 10,449.8 | 10,258.9 | 10,226.0 | 10,416.8 | 10,484.1 |
| 1996 | 9,698.6 | 10,258.1 | 10,585.1 | 10,844.7 | 10,511.5 | 10,392.7 | 10,572.2 | 10,997.6 | 10,319.7 | 10,582.9 | 10,564.6 | 10,359.3 |
| 1997 | 10,025.5 | 10,447.0 | 10,735.5 | 10,732.0 | 10,631.0 | 10,730.0 | 12,200.3 | 12,212.7 | 11,785.6 | 12,167.3 | 11,950.4 | 12,329.2 |
| 1998 | 11,777.9 | 12,387.9 | 12,829.7 | 12,794.5 | 12,715.1 | 12,892.6 | 12,932.6 | 12,870.0 | 12,323.8 | 12,765.2 | 12,429.9 | 12,659.8 |
| 1999 | 11,762.2 | 12,636.2 | 12,812.7 | 12,958.8 | 12,552.0 | 12,710.0 | 13,012.5 | 12,706.9 | 12,256.0 | 12,798.8 | 12,893.7 | 13,561.9 |
| 2000 | 11,493.5 | 12,957.0 | 13,196.3 | 12,676.8 | 12,908.4 | 13,269.5 | 12,970.8 | 13,395.8 | 13,166.9 | 13,352.0 | 13,362.1 | 13,243.8 |
| 2001 | 12,403.2 | 13,139.3 | 13,444.0 | 13,184.6 | 13,063.8 | 13,300.7 | 13,041.8 | 13,455.9 | 12,786.3 | 12,347.4 | 12,416.4 | 12,646.9 |
| 2002 | 12,624.7 | 13,792.2 | 13,943.6 | 13,683.7 | 13,610.9 | 13,456.0 | 13,568.9 | 14,020.9 | 13,031.6 | 13,640.1 | 13,290.6 | 13,261.1 |
| 2003 | 13,029.1 | 13,328.8 | 13,353.2 | 13,316.1 | 14,211.3 | 13,846.0 | 13,975.0 | 14,028.3 | 13,286.5 | 13,618.9 | 13,327.5 | 13,302.0 |
| 2004 | 11,347.6 | 11,882.8 | 12,132.5 | 12,021.5 | 11,948.0 | 11,661.6 | 11,804.1 | 12,017.9 | 11,070.7 | 12,018.8 | 11,634.6 | 11,684.4 |
| 2005 | 11,377.2 | 12,049.4 | 12,340.9 | 12,322.8 | 12,043.4 | 12,344.8 | 12,303.6 | 12,587.1 | 11,728.8 | 11,401.5 | 11,799.2 | 11,921.6 |
| 2006 | 11,499.5 | 12,252.1 | 12,845.1 | 13,021.9 | 12,361.8 | 12,669.1 | 12,891.0 | 13,080.9 | 11,994.7 | 12,243.4 | 11,944.4 | 11,710.4 |
| 2007 | 11,154.2 | 11,706.2 | 11,909.3 | 12,063.2 | 12,595.2 | 12,104.1 | 12,009.8 | 12,346.5 | 11,748.3 | 11,800.9 | 11,557.7 | 10,993.0 |
| 2008 | 10,805.0 | 11,441.7 | 11,554.3 | 11,572.1 | 11,784.3 | 11,632.0 | 11,592.5 | 11,798.5 | 11,445.2 | 11,380.8 | 11,374.1 | 11,482.1 |
| 2009 | 10,965.8 | 11,308.5 | 11,334.4 | 11,019.1 | 10,810.0 | 10,615.2 | 10,300.6 | 10,338.3 | 10,067.0 | 10,145.7 | 9,861.7 | 9,927.8 |
| 2010 | 9,464.6 | 9,409.8 | 9,693.2 | 9,788.1 | 9,459.3 | 9,685.1 | 9,539.6 | 9,342.4 | 9,230.6 | 9,224.0 | 9,094.6 | 9,154.5 |
| 2011 | 8,564.3 | 8,927.3 | 8,839.8 | 8,669.6 | 8,311.6 | 8,463.2 | 8,365.0 | 8,394.5 | 8,231.9 | 5,585.2 | 5,486.2 | 5,602.2 |
| 2012 | 5,142.3 | 5,474.3 | 5,568.8 | 5,490.8 | 5,634.4 | 5,773.5 | 5,644.3 | 5,803.5 | 5,413.2 | W | W | W |
| 2013 | W | W | W | W | W | W | 3,727.8 | W | 3,639.0 | NA | NA | 1,357.3 |
| 2014 | W | W | W | W | W | W | W | W | W | W | W | W |
| 2015 | W | W | W | W | W | W | W | W | W | W | W | W |
| 2016 | W | W | W | W | W | W | W | W | W | W | W | W |
| 2017 | W | W | W | W | W | W | W | W | W | W | W | W |
| 2018 | W | W | W | W | W | W | W | W | W | W | W | W |
| 2019 | W | W | W | W | W | W | W | W | W | W | W | W |
| 2020 | W | W | W | W | W | W | W | W | W | W | W | W |
| 2021 | W | W | W | W | W | W | W | W | W | W | W | W |
| 2022 | W | W | W | |||||||||
| - = No Data Reported; -- = Not Applicable; NA = Not Available; W = Withheld to avoid disclosure of individual company data. |
| Release Date: 6/1/2022 |
| Next Release Date: TBD |