|
Download Data (XLS File) |
|
||||||||
|
||||||||
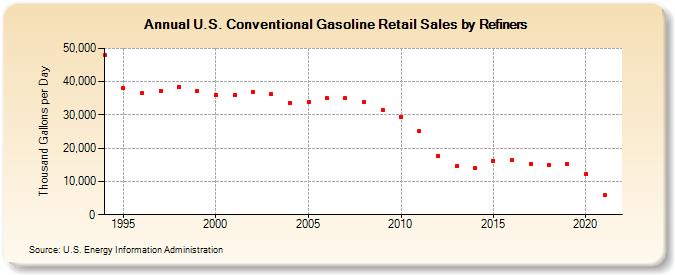
| U.S. Conventional Gasoline Retail Sales by Refiners (Thousand Gallons per Day) | ||||||||
| Decade | Year-0 | Year-1 | Year-2 | Year-3 | Year-4 | Year-5 | Year-6 | Year-7 | Year-8 | Year-9 |
|---|---|---|---|---|---|---|---|---|---|---|
| 1990's | 47,907.1 | 37,988.8 | 36,453.7 | 37,239.7 | 38,468.9 | 37,248.2 | ||||
| 2000's | 35,943.8 | 35,990.6 | 36,831.4 | 36,277.8 | 33,692.7 | 33,845.5 | 34,962.7 | 34,966.5 | 33,853.0 | 31,513.3 |
| 2010's | 29,499.2 | 25,064.8 | 17,695.8 | 14,527.4 | 13,957.6 | 16,229.5 | 16,366.1 | 15,294.0 | 14,988.2 | 15,111.1 |
| 2020's | 12,186.4 |
| - = No Data Reported; -- = Not Applicable; NA = Not Available; W = Withheld to avoid disclosure of individual company data. |
| Release Date: 6/1/2022 |
| Next Release Date: TBD |