|
Download Data (XLS File) |
|
||||||||
|
||||||||
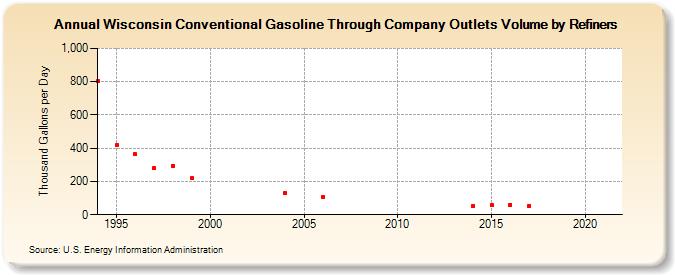
| Wisconsin Conventional Gasoline Through Company Outlets Volume by Refiners (Thousand Gallons per Day) | ||||||||
| Decade | Year-0 | Year-1 | Year-2 | Year-3 | Year-4 | Year-5 | Year-6 | Year-7 | Year-8 | Year-9 |
|---|---|---|---|---|---|---|---|---|---|---|
| 1990's | 802.4 | 418.0 | 363.2 | 278.5 | 295.2 | 220.3 | ||||
| 2000's | W | W | W | W | 130.4 | W | 107.9 | W | W | W |
| 2010's | W | W | W | W | 52.5 | 56.9 | 60.2 | 55.1 | W | W |
| 2020's | W |
| - = No Data Reported; -- = Not Applicable; NA = Not Available; W = Withheld to avoid disclosure of individual company data. |
| Release Date: 6/1/2022 |
| Next Release Date: TBD |