|
Download Data (XLS File) |
|
||||||||
|
||||||||
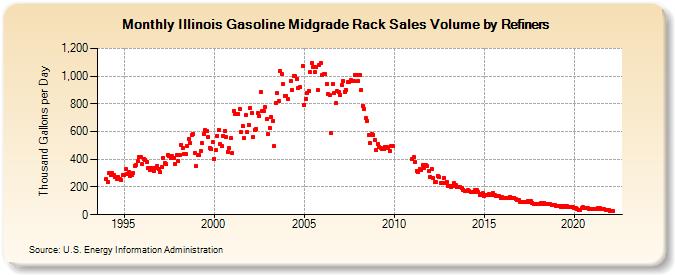
| Illinois Gasoline Midgrade Rack Sales Volume by Refiners (Thousand Gallons per Day) | ||||||||
| Year | Jan | Feb | Mar | Apr | May | Jun | Jul | Aug | Sep | Oct | Nov | Dec |
|---|---|---|---|---|---|---|---|---|---|---|---|---|
| 1994 | 254.8 | 233.3 | 297.9 | 283.6 | 300.5 | 289.7 | 273.8 | 259.1 | 271.8 | 256.3 | 249.7 | 289.3 |
| 1995 | 284.6 | 327.4 | 291.5 | 306.1 | 280.5 | 284.4 | 298.3 | 355.0 | 361.6 | 384.0 | 418.2 | 413.0 |
| 1996 | 364.4 | 404.2 | 395.5 | 381.9 | 335.2 | 323.2 | 340.5 | 340.3 | 315.6 | 335.4 | 351.6 | 332.7 |
| 1997 | 307.2 | 345.0 | 409.2 | 370.6 | 362.5 | 430.4 | 424.5 | 411.1 | 421.3 | 411.9 | 364.2 | 429.2 |
| 1998 | 385.4 | 428.5 | 505.5 | 482.6 | 438.8 | 436.9 | 498.7 | 547.9 | 517.3 | 578.2 | 583.8 | 445.1 |
| 1999 | 349.3 | 431.3 | 431.8 | 460.6 | 514.4 | 581.6 | 610.9 | 603.1 | 559.2 | 483.5 | 474.2 | 525.0 |
| 2000 | 403.4 | 467.2 | 571.0 | 607.7 | 506.9 | 492.3 | 569.8 | 606.6 | 560.3 | 454.9 | 479.1 | 551.5 |
| 2001 | 447.0 | 747.5 | 726.6 | 729.8 | 729.3 | 763.2 | 595.7 | 640.6 | 550.4 | 718.8 | 595.5 | 650.7 |
| 2002 | 768.9 | 736.3 | 562.4 | 613.3 | 622.0 | 731.9 | 708.7 | 886.6 | 747.7 | 747.7 | 775.3 | 687.4 |
| 2003 | 580.2 | 626.0 | 704.2 | 674.8 | 492.2 | 809.2 | 876.3 | 817.7 | 1,035.6 | 1,018.7 | 942.7 | 858.8 |
| 2004 | 858.6 | 835.5 | W | 964.9 | 903.1 | 1,002.6 | 997.6 | 982.6 | 912.7 | 919.5 | W | 1,073.3 |
| 2005 | 792.8 | 837.6 | 879.9 | 892.6 | 1,028.2 | 1,098.1 | 1,066.0 | 1,029.1 | 1,066.7 | 898.6 | 1,078.7 | 1,095.0 |
| 2006 | 1,008.8 | 1,013.6 | 1,014.1 | 941.4 | 873.4 | 863.4 | 589.4 | 939.5 | 879.6 | 802.4 | 890.4 | 887.5 |
| 2007 | 864.9 | 937.9 | 966.1 | 887.5 | 903.3 | 959.3 | 956.8 | 969.5 | 963.4 | 967.9 | 1,006.3 | 1,008.9 |
| 2008 | 963.9 | 1,010.7 | 898.0 | 786.2 | 765.3 | 694.7 | 679.1 | 577.7 | 516.9 | 581.1 | 577.4 | 540.0 |
| 2009 | 465.0 | 512.0 | 489.6 | 484.4 | 474.6 | 471.1 | 489.0 | 488.0 | 478.2 | 460.4 | 497.4 | 498.6 |
| 2010 | W | W | W | W | W | W | W | W | W | W | W | W |
| 2011 | 399.4 | 415.6 | 381.3 | 316.1 | 305.7 | 331.6 | 326.1 | 358.3 | 336.4 | 361.2 | 349.0 | 319.0 |
| 2012 | 274.8 | 332.8 | 263.1 | 234.3 | 234.9 | 282.2 | 273.7 | 227.0 | 228.4 | 266.0 | 225.8 | 239.1 |
| 2013 | 210.1 | 209.3 | 198.5 | 204.4 | 225.4 | 215.2 | 197.5 | 199.9 | 196.7 | 193.7 | 180.3 | 171.8 |
| 2014 | 174.3 | 175.2 | 169.1 | 162.1 | 166.0 | 166.2 | 175.6 | 176.3 | 164.9 | 144.5 | 147.5 | 153.9 |
| 2015 | 136.7 | 142.4 | 144.5 | 146.8 | 143.0 | 138.9 | 155.9 | 142.1 | 135.3 | 132.0 | 133.1 | 122.1 |
| 2016 | 124.7 | 119.6 | 121.3 | 121.9 | 123.9 | 131.0 | 120.8 | 121.0 | 122.6 | 114.0 | 109.5 | 103.4 |
| 2017 | 94.5 | 89.9 | 94.7 | 94.0 | 91.9 | 96.1 | 91.9 | 99.3 | 86.4 | 80.3 | 78.7 | 80.4 |
| 2018 | 77.8 | 79.8 | 83.2 | 76.3 | 81.7 | 78.9 | 79.0 | 75.0 | 75.6 | 70.1 | 68.2 | 66.9 |
| 2019 | 60.6 | 61.6 | 61.0 | 55.7 | 64.3 | 65.0 | 54.3 | 59.3 | 56.3 | 58.8 | 56.2 | 53.7 |
| 2020 | 49.9 | 47.2 | 38.1 | 31.9 | 36.0 | 47.9 | 52.2 | 49.8 | 46.5 | 45.8 | 41.1 | 40.6 |
| 2021 | 38.7 | 40.1 | 40.0 | 41.5 | 45.5 | 45.8 | 43.7 | 43.3 | 38.2 | 35.2 | 33.6 | 31.6 |
| 2022 | 28.8 | 26.8 | 26.6 | |||||||||
| - = No Data Reported; -- = Not Applicable; NA = Not Available; W = Withheld to avoid disclosure of individual company data. |
| Release Date: 6/1/2022 |
| Next Release Date: TBD |